by C Hamilton
What is happening in China is really scary, both for those currently at risk and for the rest of us due to the lack of transparency. Whether this is contained or metastasizes seems to really be in the balance, at this time. The last time the world faced a global pandemic of epic proportions was the 1918/1919 Spanish flu. While not of the Black Plague proportions, (which wiped out approx. 1/3rd of Europe’s population in a five year span as well as much of Eurasia), the Spanish flu influenza outbreak was horrific. Obviously, the world population was far smaller at the time (less than 2 billion) and the world was far less interconnected by high speed transportation and open borders, that now exist. Still, approximately 500 million were infected with Spanish flu (a quarter of the worlds population) and somewhere between 50 to 100 million perished due to the illness (between 3% to 5% of earths population).
At present, if “just” 1% were to perish globally due to the Coronavirus, this would mean something like 75 million lost. A similar outcome to that of the Spanish flu would mean something like the loss of 200 to 400 million persons…and a similar outcome to that of the Black Plague taking 1/3 of earths population is too macabre to even fathom.
This is dark stuff and hopefully nothing of previous pandemic proportions takes place, but seems important to roll-out the historical record to see how serious this could become. Also very noteworthy of the Spanish flu, the bullseye of those killed was among the childbearing population, so the outsized impact on the under 65 year-old population was atypical.
Speaking of the Spanish flu, I wanted to show the impact that the 1918-1919 deaths had on US population growth and compare the inversely moving US debt to GDP ratio. In the chart below, the yellow line is the annual growth of the US under 65 year-old population versus US debt to GDP (blue columns in periods of flat or declining debt to GDP, red columns in periods of rising debt to GDP). The two are clearly inversely correlated…debt, once used for warfare, is now being substituted for decelerating population growth and declining potential for economic activity (absent more debt/lower interest rates).
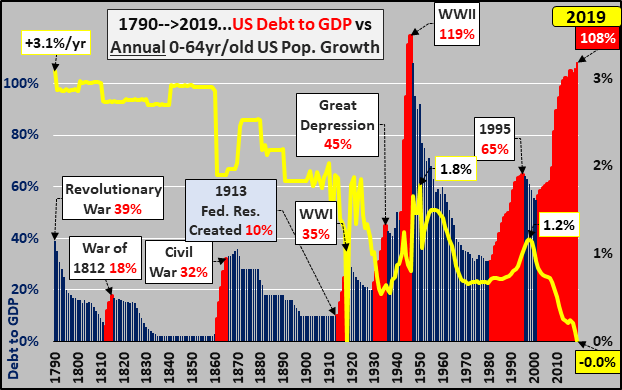 Looking at the annual US population growth, the deceleration from 1790 to present isn’t hard to see, but the sharp collapse in growth due to influenza at the end of WWI takes a little closer look. However, after the influenza was contained by 1920’ish, the under 65 year-old growth rate immediately recovered to trend growth before continuing its deceleration.
It just so happens that 2019 and 1918/1919 had something very important in common, they were the only years in US history with population decline among the under 65 year-old population. As per the Census, (HERE), while the total US population grew by 1.55 million (0.48%) in 2019, all the net population growth came among the 65+ year-old population (which grew about 1.625 million). This means that in 2019, the under 65 year-old population declined by about 70 thousand. The only time this ever occurred previously in US history was at the height of a global pandemic. Yet, there was no pandemic in 2019…just a population unwilling to enter into parenthood at record proportions and immigration rates about half of what they were during the previous decade. Of course, if a pandemic were to hit now with an under 65 year-old annual growth rate already below anything the US has ever experienced, the population declines would naturally be unlike anything the US has ever seen.
The rationale for the continued declining fertility rates and births appears to be the continued growth of federal debt well in advance of economic activity. The mounting $23+ trillion in federal debt (and quadruple that in unfunded liabilities) will never be repaid and can’t honestly be serviced at anything but Federal Reserve dictated minimal interest rates. Thus, the Fed continues to rig the interest rates, which rigs stocks and commodities…and the outcome is unnaturally high asset appreciation…which rewards elderly and institutional asset holders and punishes young, poor, and those absent assets. Young and poor are suffering from costs of living rising far faster than incomes. Marriage are being put off and the undertaking of childrearing is a choice that can simply be avoided with widely available birth control. Simply put, it is the Federal Reserve coping mechanisms that are causing record low fertility rates as young adults are financially unable/unwilling to undertake children. The Fed is preserving the present for the elderly and institutions at the expense of the young and poor present and future.
Clearly, a pandemic at this point in time would send the US in deep depopulation and likely send the Fed into QE++++ to avoid a free market determining asset prices. The result of pandemic, and Fed induced costs of living continuing to skyrocket above incomes, would surely have further downward impact on US births (already down 12% since 2007…detailed HERE).
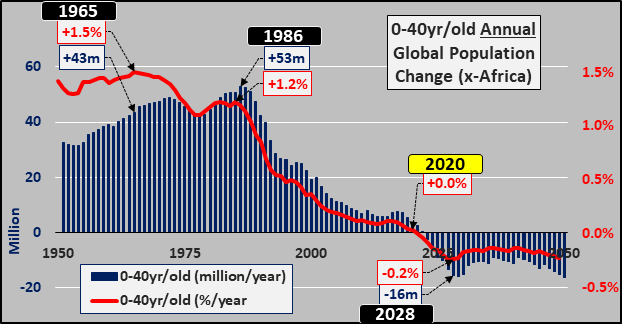
And what of the global picture and America’s ability to import growth via immigration? The chart below shows the annual change in the global under 40 year-old population (excluding Africa…I exclude Africa due to low relative rates of emigration, low rates of income/savings/credit, low rates of consumption). Blue columns are annual change in millions and red line is annual change as a percentage of world population, X-Africa). 1986 was peak annual growth of +53 million under 40 year-olds (a 1.2% increase).
It just so happens that in 2020, the growth of the global population (x-Africa) capable of present and future childbearing has ceased. Female fertility rates beyond 40 years-old plummet and females are sterile by 45 to 50 years-old. From this point on, every year there will be fewer persons capable of childbearing and obviously fewer children indefinitely (both x-Africa). To this point, global annual births, excluding Africa, have been declining since 1989 and are down at least 15% from that ’89 peak…and perhaps as much as -20%, once all data for 2019 is available).
While the worlds over 40 year-old population may be facing overpopulation, the global under 40 year-old population (x-Africa or the part of the world that consumes 97% of everything) has begun depopulation. And all this prior to any loss of life due to a potential pandemic.
US and global population data from US Census and UN World Population Prospects 2019…
Views: