Market participants want to believe today’s bull market is similar to 1995.
In 1995, July to be specific, the Fed cut rates as the stock market was setting a new record high. The next Fed meeting is July 31st, and the market is currently trading near record highs.
As Upfina recently tweeted:
Powell stated, “An ounce of prevention is worth a pound of cure.” That implies the Fed is going with insurance cuts like it did during 1995 in which it successfully prevented a recession.
— UPFINA (@UPFINAcom) June 22, 2019
That is correct, and, when the Fed cut interest rates as a preventative measure, U.S. equity markets have historically done very well. However, a quick look at the history of Fed rate cuts, and subsequent market tantrums, suggests 1995 is more of an anomaly rather than the rule.
As J.P. Morgan noted, the three “insurance cut” easing cycles in 1980, 1995 and 1998 appear to be outliers. ”
“The late 1990’s rate cuts were used as insurance against Mexican and Russian default and collapse of hedge fund Long-Term Capital Management at the time, bolstered the equity market. The only other time the S&P 500 saw stronger performance following a rate cut was in 1980. At the time, there was an 8.5% reduction in the Fed funds rate from 20% to 11.5% — a level of monetary easing that is ‘obviously not possible in the current conjuncture,’”
Another thing about the 1980’s was that the economy was just coming out of back-to-back recessions, valuations were extremely low, and dividends were high. Reagan had just passed tax reform, the banks were deregulated, and inflation and interest rates were plummeting. Household debt was only about 60% of net worth and just starting the near 40-year period of “leveraging up” which was a massive boost to consumption and ultimately economic growth.
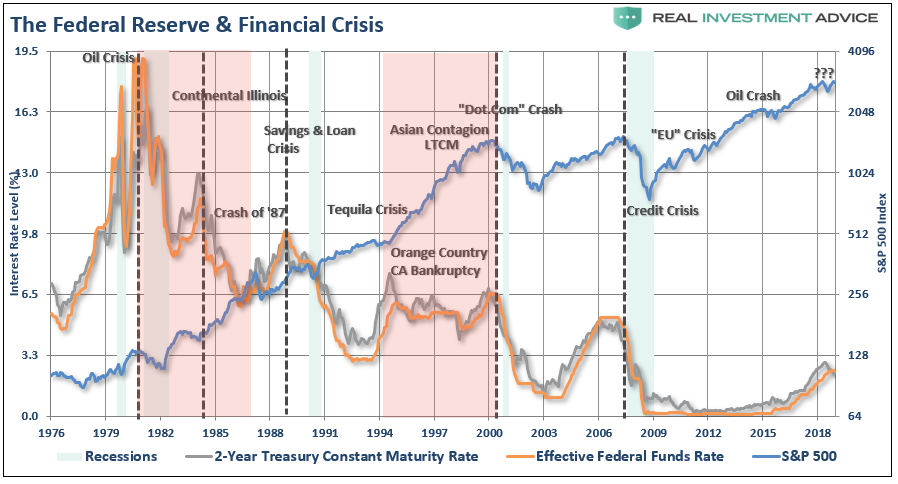
However, despite the market performing well, the two periods in the 1980s where the Fed hiked rates led to the “Continental Illinois” failure, the “Savings and Loan crisis,” and the “1987 Crash.”
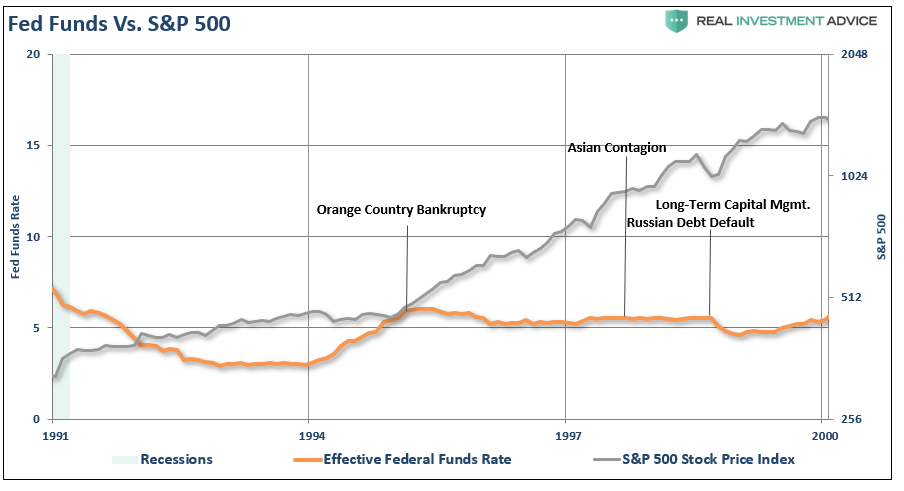
The mid-late 1990’s rate cuts was also another anomalous market environment. The Fed began a rate hiking campaign in 1993 as the economy began to stretch its legs post the 1991 recession. However, the Fed cut rates slightly in 1995, and again in 1998, to offset the risk imposed from three major market-related events. Ironically, it was the Fed’s tightening of monetary policy which caused those events to begin with.
Despite the cuts being relatively minimal, they only likely provided more liquidity to drive the massive market melt up, which was occurring from 1995 to 2000. It was a period of market nirvana as the internet became mainstream changing the way information was accessed, utilized, and institutionalized. Mutual funds were a virtual “Hoover vacuum” sucking up retail assets and lofting asset prices higher. Pension funds were finally allowed to invest in stocks rather than just Treasuries which brought massive buying power to the markets. Foreign flows also poured into Wall Street to chase the raging bull market higher. Lastly, E*Trade hit the internet and further opened the doors of the “WallStreet Casino” to the masses.
Yes, for a brief moment, the markets lofted higher as “irrational exuberance” prevailed. Of course, while the rate cuts in 1995 didn’t slow the growth of the “bubble” immediately, it wasn’t long before all the gains were wiped out by the “Dot.com” crash.

Why This Isn’t 1995?
There are lots of other differences between today and 1995.
As noted above, the Fed cut rates in 1995 as an concerns mounted over this:
“The sudden plunge of Orange County, Calif., into bankruptcy shook the market for public borrowing across the country yesterday, threatening to make it more expensive for many localities to borrow. It also left some Wall Street firms facing the potential of big losses.
And, it served as a warning of how rapidly new and popular financial strategies can sour, leaving an apparently prosperous county unable to pay its bills”
Geez, you could have written that same statement in 2008 as well.
However, let me explain why I disagree with the following mainstream thesis:
“There are certainly parallels between the environment today and 1995-1996. Back then, the Fed embarked on a series of three interest rate cuts (75 basis points) in total, the catalyst being low inflation rather than a recessionary economy, remarkably similar to today. The whole cycle lasted for seven months.” – CNBC
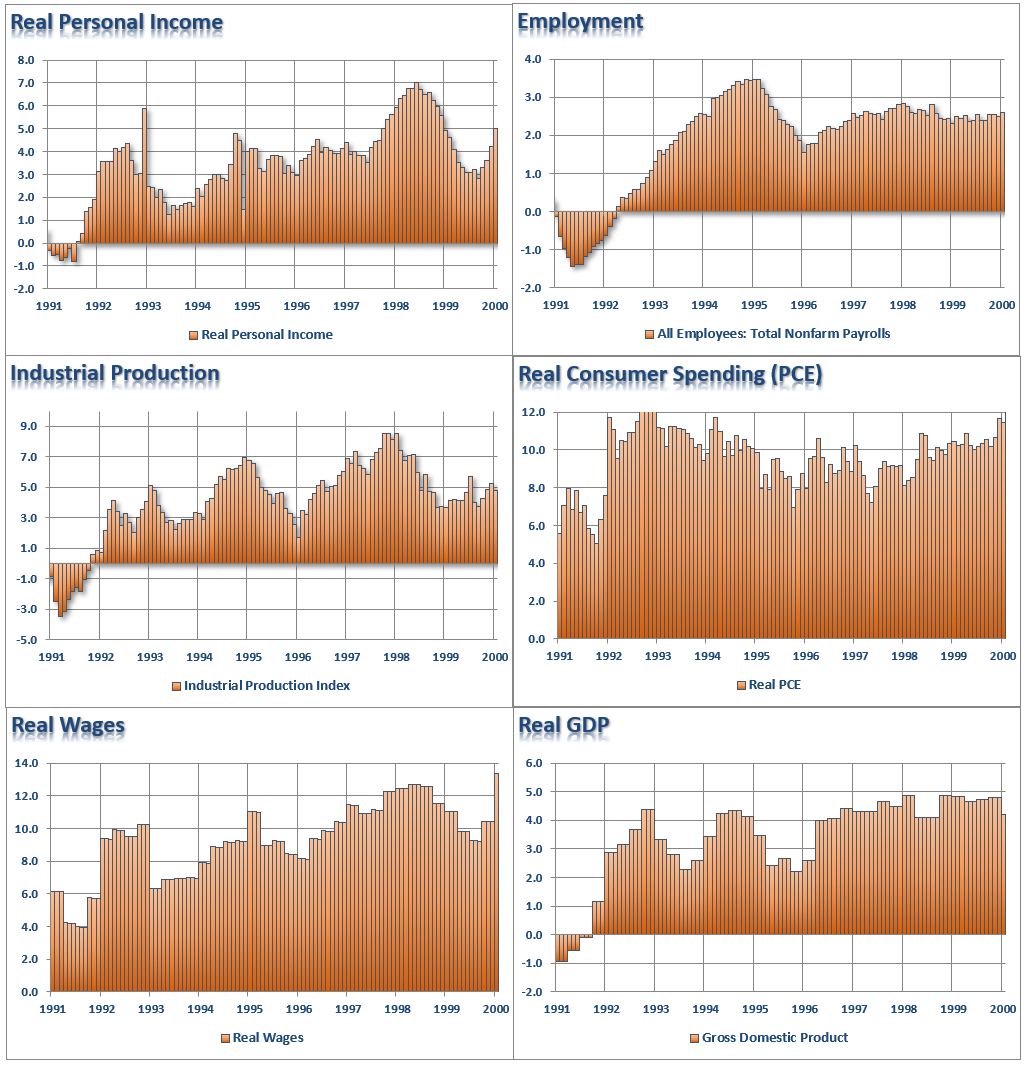
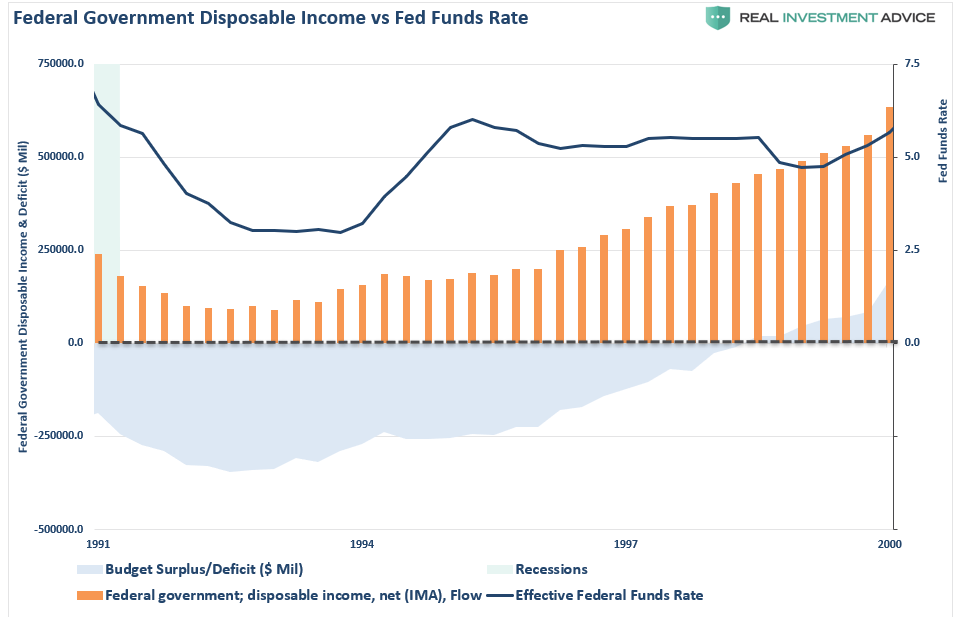
Let’s take a closer look. The chart below shows several key economic indicators from 1991 to 2000.
- Personal Incomes averaged 4% and were rising to 5% on an annual rate at the turn of the century.
- Employment averaged a 2.5% annual growth rate and was solid heading into 2000.
- Industrial Production averaged about 5% annual growth and was rising in the last few months of 1999.
- Real Consumer Spending was rising strongly headed into 2000, averaging nearly a 12% growth rate.
- Real Wages were climbing steadily from 1991 to 1999 and hit a peak of almost 14% annualized in December 1999.
- Real GDP was running at more than 4% annually in December of 1999.
In 1995, there was little to be worried about from an economic perspective. The Fed cut rates to hedge off the risk of a “financial contagion” from the Orange County bankruptcy.
But also note, there was absolutely “no sign of recession” in late 1999 either.
The recession, and “Dot.com” crash, started just a few months later anyway.
However, according to CNBC, today’s economic backdrop is much like that of 1995.
Or is it? Let’s compare.
- Personal Incomes currently average about 2% versus 4% in 1995
- Employment is averaging about a 1.5% annualized growth rate versus 2.5% in 1995.
- Industrial Production has averaged about 2% annual growth vs 5% previously.
- Real Consumer Spending has averaged about 4% annual growth versus 8-10% in 1995.
- Real Wages have averaged about a 3.5 annual growth rate versus 8-10% in 1995.
- Real GDP has averaged about 2% annual growth over the last decade versus 3% previously.
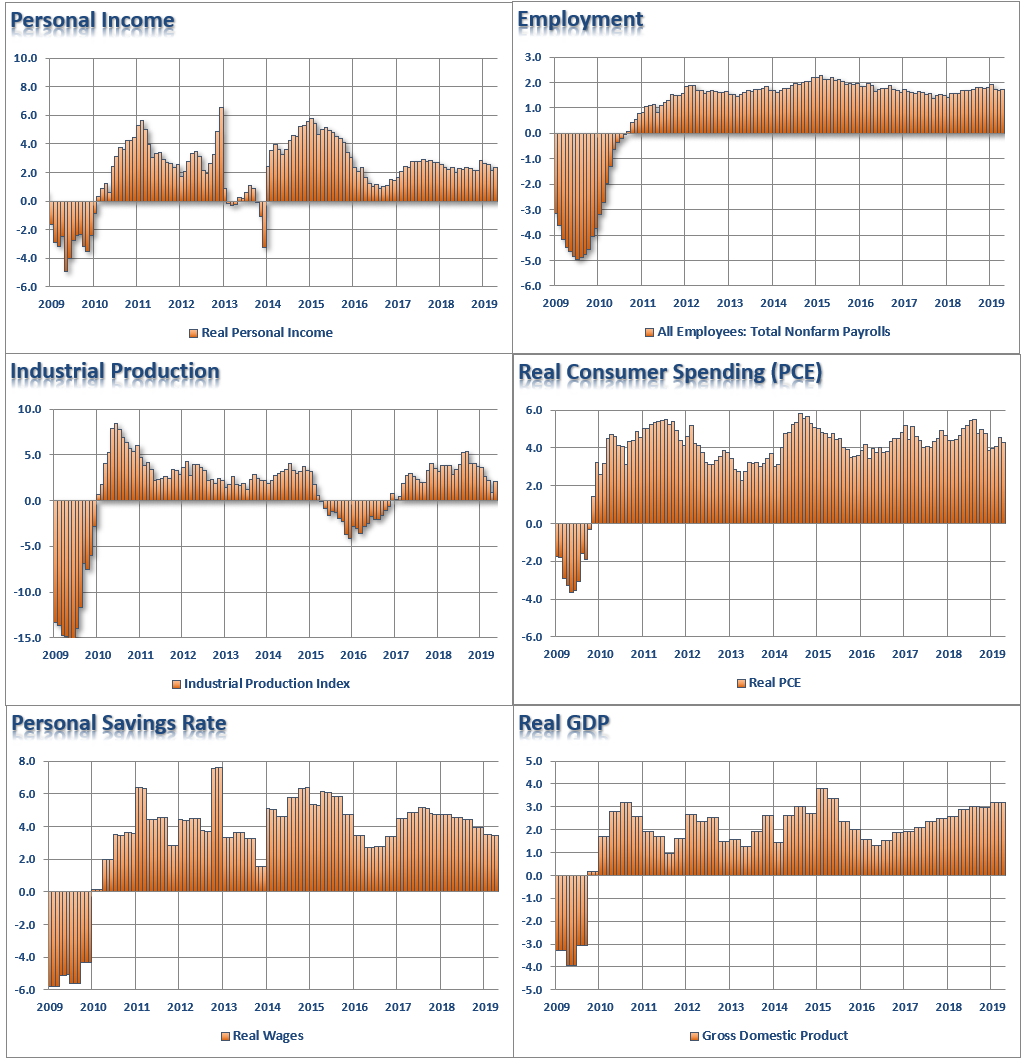
Just as it was in 1999, there is “clearly no sign of recession” in the economic data currently.
But that doesn’t mean a recession can’t start more quickly than you think.

It’s The Debt Stupid
One of the biggest differences between today and the 1990’s is the level of indebtedness. In the 1990’s, the government ran a slight deficit coming out of the 1991 recession which eclipsed $250 Billion at time. With some slight of hand, President Clinton temporarily turned the deficit into a surplus by borrowing a $2 trillion from Social Security allowing Federal disposable income (tax revenue and other governmental income less mandated spending) to rise which supported economic growth headed into 2000.
Such is most assuredly not the case today. Since 2009, the Federal government has consistently run a deficit averaging $750 billion annually. Also, unlike the 1990’s where Federal disposable income was positive, today, it is negative for the second time since the financial crisis. Said differently, all discretionary spending plus some mandated spending must come from borrowed funds.
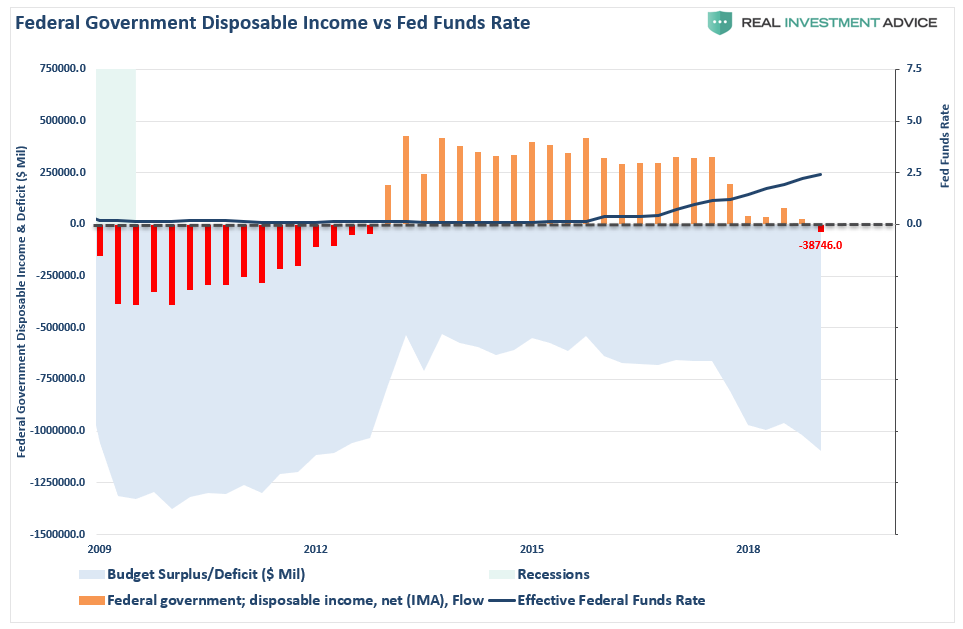
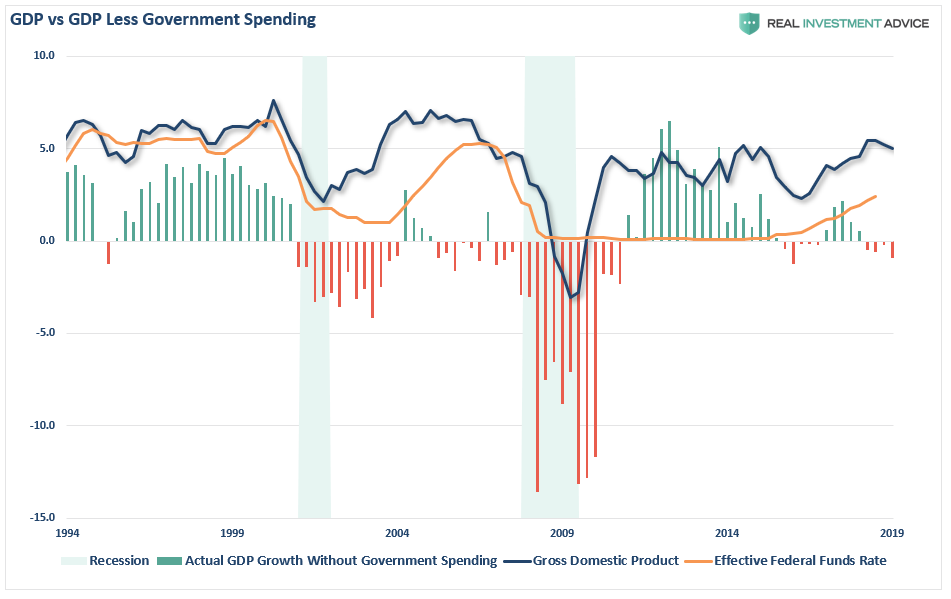
More importantly, economic growth from 1995 through 2000 was positive even after removing the impact of government spending. Today, if you extract out government spending, the U.S. economy has had a negative growth rate for the last 4-quarters. Or rather, the U.S. economy has been in recession.

The Case For The Final Bull Run
While the current economic backdrop is clearly not what it was in the 1990’s, there is nonetheless a case for a continued bull market in the short-term.
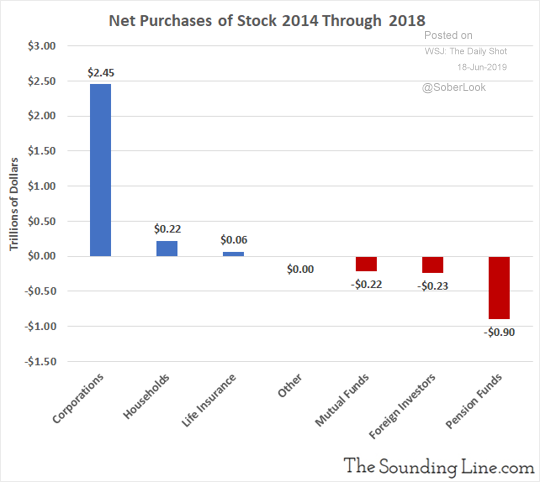
First, as I discussed on Tuesday, corporate share buybacks currently account for roughly all “net purchases” of U.S. equities in recent years. To wit:
But that may well now be coming to an end. As the benefit of the recent tax cut legislation fades and corporate debt has ballooned, the amount of capital for share repurchases is declining.
“It is likely that 2018/2019 will be the potential peak of corporate share buybacks, thereby reducing the demand for equities in the market. This “artificial buyer” explains the high degree of complacency in the markets despite recent volatility. It also suggests that the “bullish outlook” from a majority of mainstream analysts could also be a mistake.
If the economy is weakening, as it appears to be, it won’t be long until corporations redirect the cash from “share repurchases” to shoring up operations and protecting cash flows.”
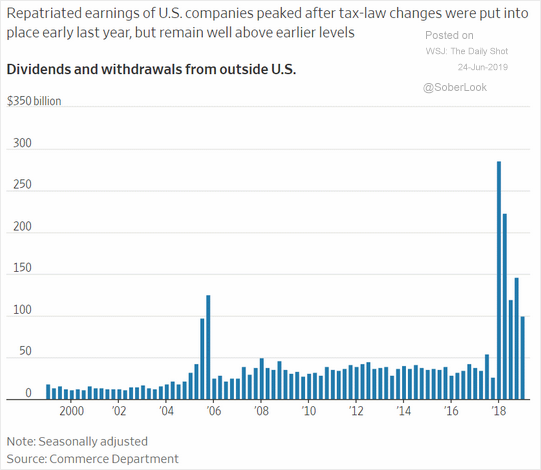
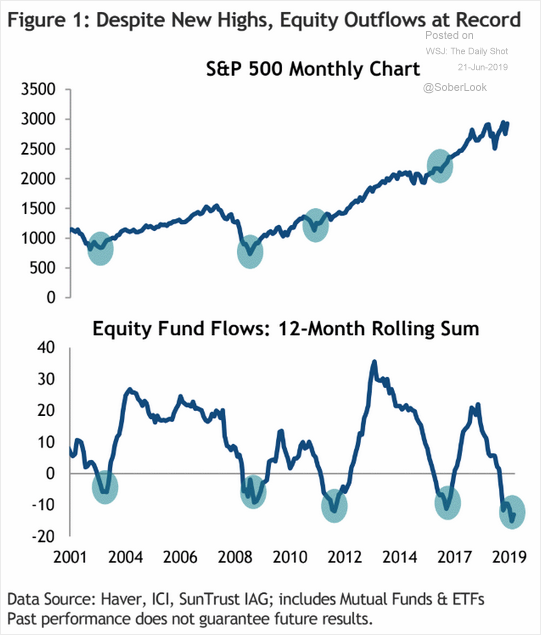
There is still likely enough “juice in the tank” in repatriations to keep the markets elevated for a while longer. Also, equity outflows have currently reached levels which have denoted previous points where a reversal occurred and equity inflows pushed asset prices higher.
However, just like in 1995, when the Fed cut rates for the first time, equities did lift higher creating one of the biggest asset bubbles in human history. But that bubble popped roughly 10-years after the bull market started.
Today, the markets have already experienced a 300%+ increase and is already 10-years into the current expansion. While it is certainly possible for equities to push higher from here, it is likely the last leg of the current bull advance.
If history is any guide, the next mean reverting event will likely wipe out of the bulk of the gains made over the last 5-years.
Today isn’t 1995.
But even if it is, the end result will likely be the same also.