Wolf Richter wolfstreet.com, www.amazon.com/author/wolfrichter
But some flat spots are showing up!
Just after I reported on the minuscule 1.4% year-over-year growth of per-capita “real” disposable income and the lowest saving rate in 12 years — for the lucky ones — there’s another asset-bubble doozie: The S&P CoreLogic Case-Shiller National Home Price Index for November, released this morning, rose 6.2% year-over-year (not-seasonally-adjusted). The index has now surpassed by 6.1% what was afterwards called the crazy peak of Housing Bubble 1 in July 2006 and is up 46% from the bottom of Housing Bust 1:
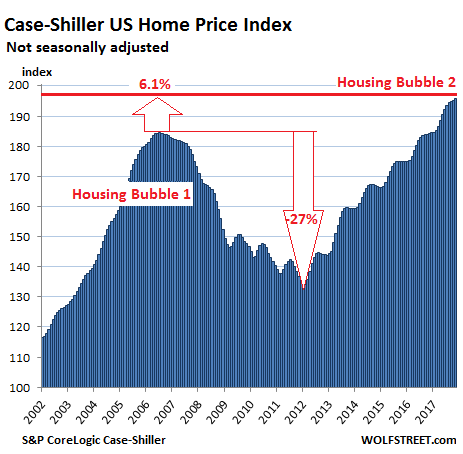
Real estate prices are a result of local dynamics but are also impacted by national and global factors, including monetary policies and foreign non-resident investors trying to get their money out of harm’s way. This causes local housing bubbles, operating on their own schedules. When enough of them occur simultaneously, it becomes a national housing bubble. See chart above.
The Case-Shiller Index is based on a rolling three-month average; today’s release was for September, October, and November data. Instead of median prices, the index uses “home price sales pairs,” for example for a house that sold in 2010 and then again in 2017. The index provider incorporates other factors and uses algorithms to adjust the price movement into an index data point. The index was set at 100 for January 2000. An index value of 200 means prices as figured by the algorithm have doubled since then.
Here are the most magnificent leaders among the housing bubbles in major metro areas:
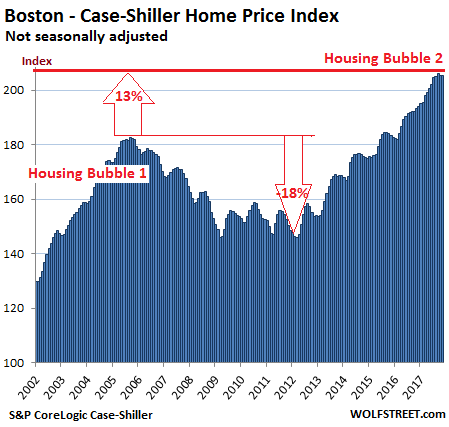
Boston:
The index for the Boston metro area edged down again on a monthly basis, the second decline in a row after 22 months in a row of increases. It has essentially been flat for four months but is still up 6.3% year-over-year. The slight monthly decline could be within the normal seasonal variations but there were no seasonal variations during the relentless surge in 2016 and 2015. During Housing Bubble 1, from January 2000 to October 2005, the index for Boston soared 82% before plunging. The index now exceeds the peak of Housing Bubble 1 by 12.5%:
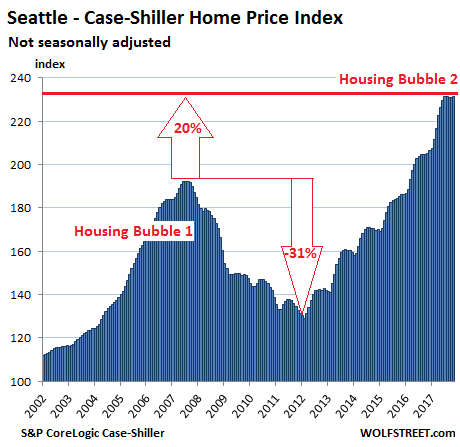
Seattle:
The Case-Shiller home price index for the Seattle metro ticked up a smidgen on a month-to-month basis, after the first two back-to-back declines since the end of 2014! It has now been flat for the past five months. However, flat spots or slight declines in the index this time of the year were not unusual before 2015. The index is up 12.7% year-over-year, 20% from the peak of Housing Bubble 1 (July 2007), and 79% from the bottom of Housing Bust 1 in February 2011:
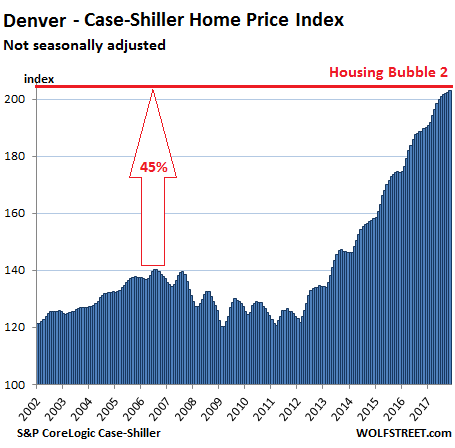
Denver:
The index for the Denver metro ticked up again on a monthly basis, the 25th increase in a row. It is up 7.0% year-over-year and has surged 45% above the prior peak in July 2006. Instead of the craziness of Housing Bubble 1, Denver experienced more “normal” home-price increases, and was therefore also spared the ravages of Housing Bust 1. But in 2012, Housing Bubble 2 erupted in full force:
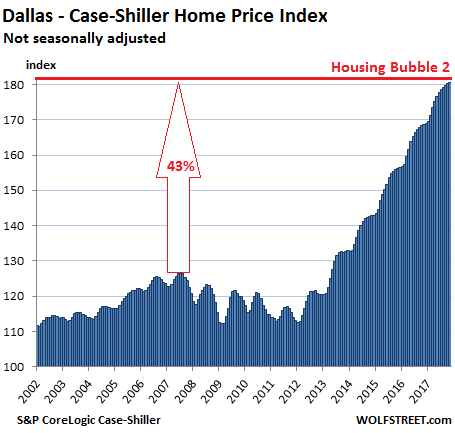
Dallas-Fort Worth:
The index for the Dallas-Fort Worth metro ticked up again on a monthly basis — the 46th month in a row of increases. It is up 7.0% year-over-year and 43% from the prior peak in June 2007. Like Denver, Dallas experienced saner times during Housing Bubble 1. But prices began to surge relentlessly in 2012:
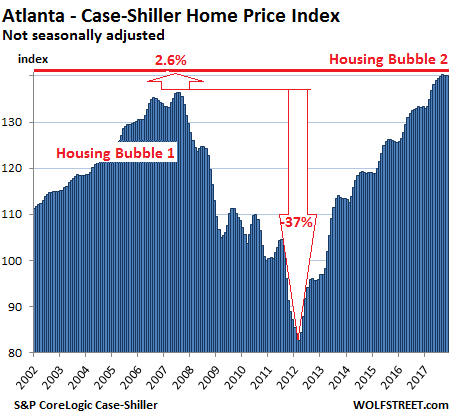
Atlanta:
The home price index for the Atlanta metro has now been flat (actually down a tiny bit) for three months in a row, in line with prior seasonal declines, but is still up 5.2% year-over-year and 2.6% above the peak of Housing Bubble 1 in July 2007. From that peak, the index plunged 37%. It’s now up 70% since February 2012:
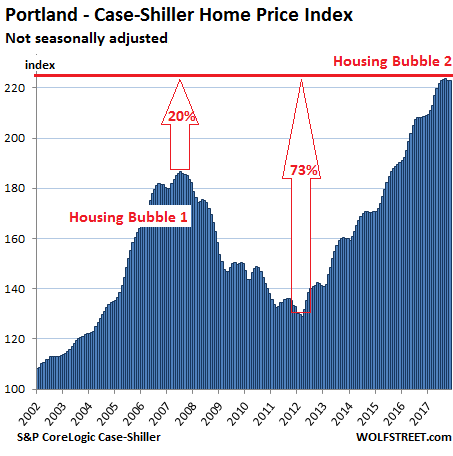
Portland:
The Case-Shiller index for Portland was flat in November, and has now been flat or slightly down for five months in a row, and for now still in the range of normal seasonal patterns. The index is up 6.9% year-over-year and has skyrocketed 73% in five years. It’s 20% above the crazy peak of Housing Bubble 1 and has ballooned 123% since 2000:
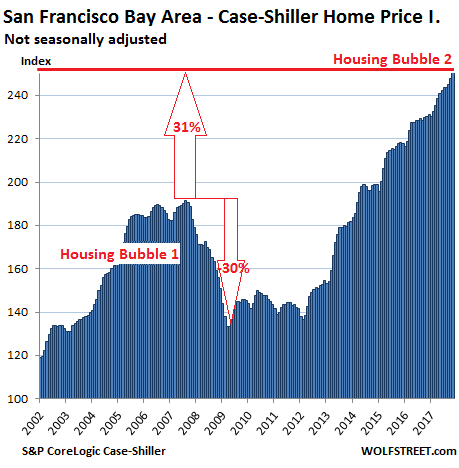
San Francisco Bay Area:
The index for “San Francisco” covers the county of San Francisco plus four other Bay Area counties — Alameda, Contra Costa, Marin, and San Mateo (the northern part of Silicon Valley). It jumped 1.4% for the month, after jumping 1.2% in the prior month. It’s up 9.1% year-over-year, up 31.3% from the insane peak of Housing Bubble 1, and up 85% from the end of Housing Bust 1. The index has surged 151% since 2000:
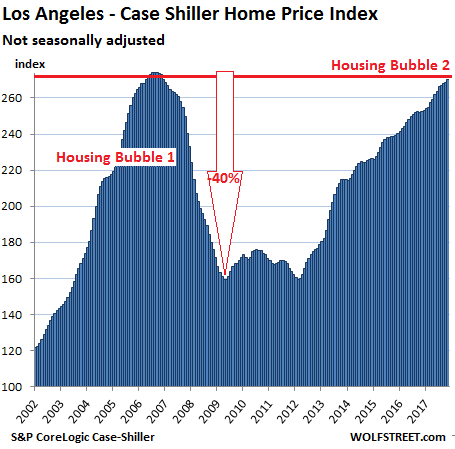
Los Angeles:
Home prices in the Los Angeles metro, as tracked by the index, rose 0.7% for the month, and 7.0% year-over-year. LA’s Housing Bubble 1 was in a category of its own in its steepness on both sides, with home prices skyrocketing 174% from January 2000 to July 2006, before collapsing and surrendering much of the gains. The index has skyrocketed since Housing Bust 1 and is now within a smidgen of the prior insane peak:
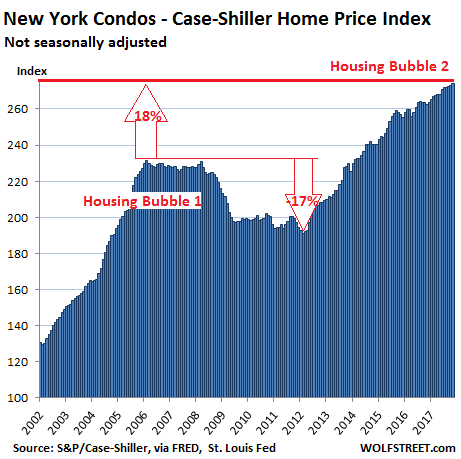
New York City Condos:
Case-Shiller has a special index for New York City’s condo because this is such a vast market. And this index rose another notch in November and is up 4.4% year-over-year. The index soared 131% from 2000 to February 2006 during Housing Bubble 1, barely deflated during the bust before QE unleashed money from around the world which then re-floated Wall Street more than anything else. The index is 18% above the peak of Condo Bubble 1 and has nearly tripled over the past 17 years:
This is asset-price inflation at work — now that “homes” have become a global asset class. These homes didn’t get 50% bigger or 50% nicer over the past few years. Instead the purchasing power of the dollar with regards to these assets has been purposefully demolished by the Fed’s monetary policies that resulted in practically no wage inflation, moderate consumer price inflation, but massive asset-price inflation. Asset-price inflation without corresponding wage inflation means that the value of labor (wages earned) with regards to homes and other assets has been crushed — a phenomenon now hypocritically called the “affordability crisis” in many big urban areas in the US.