via Dave Kranzler:
Fed officials always understate risks embedded in the system.
Just like the stock market, fixed income prices rallied sharply after the Fed and the Trump Government acted to arrest the sell-off in the stock market in late December.
The average household is getting squeezed from higher interest payments on the record amount of household debt that has accumulated over the last 10 years.
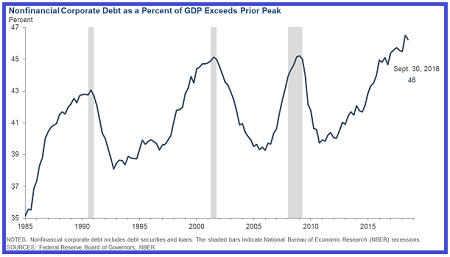
An elevated level of corporate debt, along with the high level of U.S. government debt, is likely to mean that the U.S. economy is much more interest rate sensitive than it has been historically. – Robert Kaplan, President of the Dallas Fed
Fed officials always understate risks embedded in the system. Translated, the statement above implies the Fed is worried about the amount of debt accumulated in the U.S. economic system over the last 8 years. Kaplan specifically referenced the $6.2 trillion in corporate debt outstanding as a reason for the Fed to stop raising the Fed funds rate. Non-financial corporate debt as a percentage of GDP is now at a record high:
More eye-raising for me was the warning issued by the BIS (Bank for International Settlements – the global Central Bank for central banks). The BIS warned that the surging supply of corporate debt, specifically the amount of BBB-rated debt, has left the credit market vulnerable to a crash once the economic weakness triggers ratings downgrades. A large scale ratings downgrade of triple-B issuers to junk would cause an avalanche of selling from funds which can’t hold non-investment grade debt. This has the potential to seize-up the credit markets.
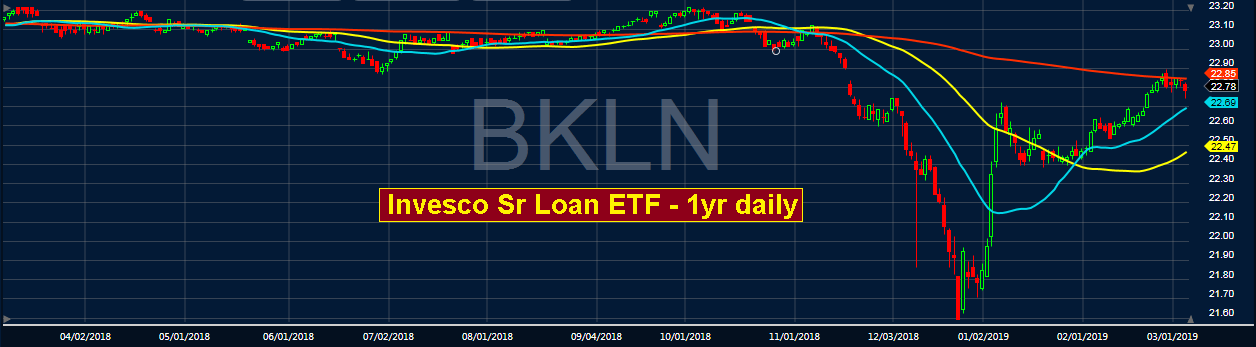
The BIS would not issue a warning like this unless it was already seeing troubling developments in the numbers to which it has access. Recall that leveraged loan ETFs plunged in value the last two months of 2018. Same with high-yield bond ETFs, though the drop in leveraged bank loans was more troubling given their status as senior secured and ahead of junk bonds in the legal pecking order.
As you can see from the chart below, it looks like the value of senior leveraged bank loans may be headed south again:
Just like the stock market, fixed income prices rallied sharply after the Fed and the Trump Government acted to arrest the sell-off in the stock market in late December. But this was always a short-term “fix,” as economic fundamentals continued to deteriorate, perhaps at a hastened pace because of the Government shutdown. But neither the shutdown nor the trade war is the cause of the collapsing global economy.
More evidence the consumer is tapped out – Deutsche Bank wrote a report detailing signs that the average U.S. household is running up against its willingness and ability to assume more debt and monthly interest expense. I have been suggesting this was the case for a few months in SSJ. One indicator I thought was interesting is a chart showing that the average hours worked in sectors selling “big ticket” items is now declining (home furnishings, travel arrangement and reservation services, and used car dealers).
Another chart showed that, based on regional Fed surveys of senior loan officers at banks, demand for credit cards, auto loans, and personal loans is declining:
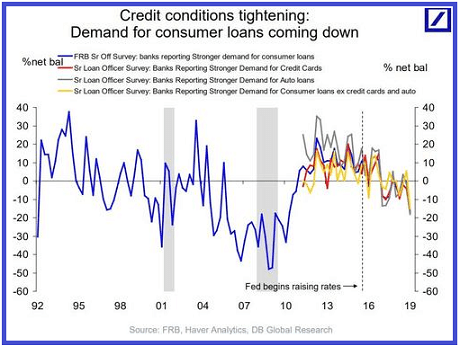
One of the reasons for the drop in loans is simply that the average consumer simply cannot afford the monthly cost of taking on additional debt, especially higher-cost credit card and auto debt. Just as significant is the fact that interest rates on these types of loans are rising quickly – i.e. the average credit card interest rate is now 17% vs. 14% a year ago. Deutsche Bank omits to explain why the interest rate on these types of loans is rising much faster than the Fed funds.
The interest rate charged on a loan reflects the “risk free” rate (Fed funds), the time value of money and – most important – the inherent risk associated with specific types of loans. Interest rates on credit cards and auto loans are rising to reflect the increased risk attached to these forms of credit – i.e. the rising delinquency and default rates.
Besides the rising cost of necessities, the average household is getting squeezed from higher interest payments on the record amount of household debt that has accumulated over the last 10 years. The chart below shows the year-over-year growth in household interest payments going back the 1960s:

The aggregate household interest payment has soared at a 15% Y/Y rate. Interest payments as a share of total household spending have jumped to the highest level since the financial crisis. Virtually, every prior time when interest payments spiked this much, a recession promptly followed.
Last but not least, as Treasury debt hits a new record every day, it was reported by the Treasury that the U.S. budget surplus in January, traditionally one of the only months of the year with a spending surplus because of tax receipt timing, was only $9 billion. This missed the consensus estimate of $25 billion and was far below the January 2018 surplus of $49 billion. For the first 4 months of the Government’s fiscal year, the budget deficit was $310 billion, 77% higher than the $175.7 billion deficit for the same period last year.
The budget deficit will surely be much higher than the $1.2 trillion annualized rate recorded in the first four months of this FY. Federal interest expense hit a record high for the four-month period. Annualized, the projected $575 billion interest expense alone for FY 2019 would be more than the entire budget deficit in FY 2014.
Finally, the Deutsche Bank report showed two graphics showing the “current conditions” index for buying cars and homes for the top 33% of households by income. The index measures the intent to make a purchase. The current conditions index for car purchases was at its lowest since 2012. For home buying, the intent to purchase index was at its lowest since 2008.