by econimica
Summary
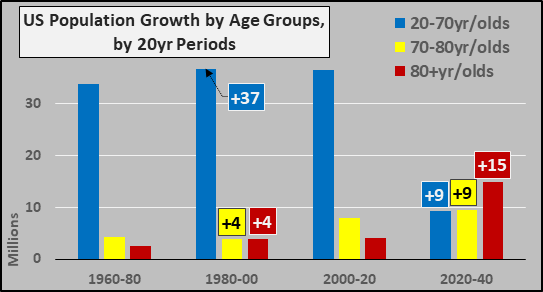
2020 through 2040, the US 20+yr/old population is estimated to grow by 15 million fewer than during past 20 years.
Of that growth, 48% will be among 80+ year olds, 28% among 70 to 80 year olds, and just 28% among those aged 20-70 years old.
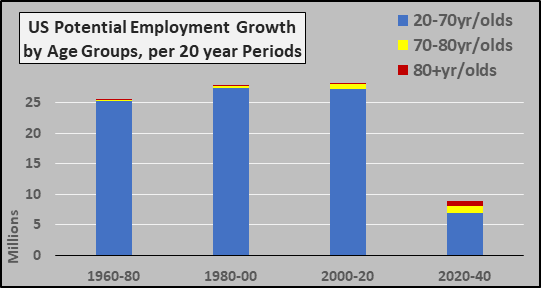
The implication for future employment is a drastic 70% deceleration of potential employment growth over the next two decades.
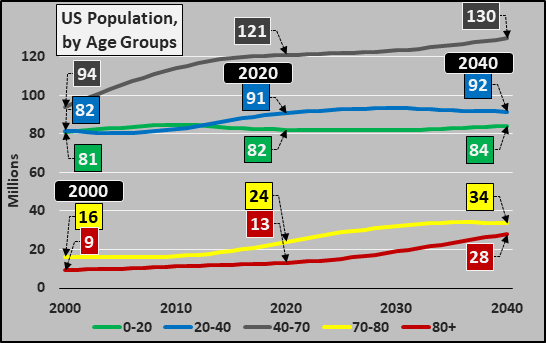
In a nation with twin trade deficits and budget deficits, the simplest of means to gauge potential growth, is to gauge the growth of the consuming population. The chart below details the changing demographic picture in the United States. According to UN and Census estimates, from 2020 to 2040, there will be little to no growth among the population of young (0-20yr/olds, green line) as I recently detailed How Low Will US Births Go?, likewise for the child-bearing population (20-40yr/olds, blue line). Meanwhile the post childbearing but still working 40-70yr/olds (grey line) will rise but the largest population increases will be among the 70-80yr/olds (yellow line), and particularly among the 80+yr/olds (red line). So what?
Breaking the above growth into twenty year periods by age segments and folding the 20 to 70 year-olds into one grouping, below, you can see how the next twenty years are nothing like the US has ever seen before. The 70+ year old population will rise by 24 million versus just an increase of 9 million among the 20 to 70 year-old working age population. However, even among the elderly, the bulk of the growth will be among the ultra-elderly 80+ year olds, representing nearly 50% of all total population growth over the next two decades.
Why do I mention this? I just happen to catch this CLOWN on CNBC yesterday talking absolute nonsense. The headline read, “Millennials are about to trigger a major ‘changeover point’ for the US economy, asset manager says”. Mr. Smead suggested if you “just do the math”…millennials are about to rock the US economy and…“In 20 years, there is going to be way more payers into the social security system and there is going to be way fewer taker-outers — and that problem will solve itself through demographics.” Apparently, Mr. Smead had not done the math. However, CNBC appeared to have no problem allowing his ignorant statements and hawking his services based on entirely erroneous statements. Hmmm.
Why This Matters
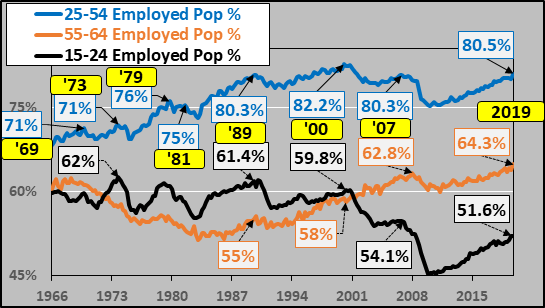
Every age group has a general labor force participation rate (detailed by the BLS HERE), forming a bell curve, from low participation among 15 to 24 year-olds, peak participation among 35 to 44 year-olds, and collapsing among 65+ year-olds. So, when there is minimal population growth among the working age populations, and those age groups that do all the work, are at historical peaks of employment to population size (chart below)…and the bulk of population growth will be among those that typically don’t work…well, we have a problem.
But participation rates among the elderly have been rising over the last decade (65 to 74yr/olds rising from 18% to 27% and estimated to rise to 32% by 2028, 75+yr/olds rising from 5% to 9% and estimated to rise to 12% by 2028). So, if we want to gauge potential employment growth (“just do the math”), it is a simple exercise. Multiply estimated population growth by age groups and their participation rates…and the simple answer is that over the next twenty years, the maximum number of potential new employees the US can support is about 1/3rd any period since WWII.
This means, at best, the US will have just 1/3rd the potential new home buyers, car buyers, tax payers, etc. etc. than anytime since WWII. Although this simple truth nor myself (as I have nothing to sell or buy, no “recommendations”) is not likely to make it on CNBC or any other “info-mercial” outlet, this is simply “just the math”. This decelerating growth is why rates will only go down, debt plus QE (and other forms of monetization to artificially boost asset prices) only become ever greater. This substitution of artificial growth for the lack of organic growth is “just the math”.
Population data via US Census Population Projections and UN World Population Prospects 2019, Employment data via BLS.
Population data via US Census Population Projections and UN World Population Prospects 2019, Employment data via BLS.
Views: