Steve Goldstein recently reported for MarketWatch that closely watched auto sales were leading economists to be more confident in their economic outlook for the rest of the year. To wit:
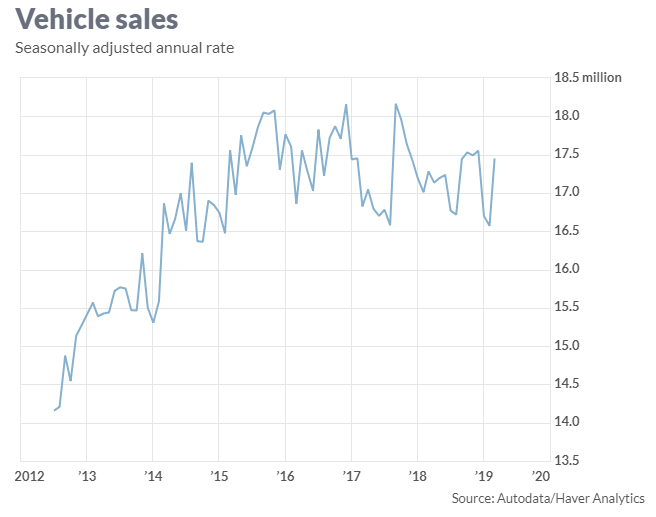
“Motor vehicle sales reached a seasonally adjusted annual rate of 17.45 million in March, up from 16.57 million in February, according to data from Autodata. That’s the highest reading in three months and represents a recovery from a downbeat start to the year. The MarketWatch-compiled consensus expectation was for a 16.8 million rate.”
Jim O’Sullivan of High-Frequency Economics also made a similar point.
“The data reinforce our view that the slowing in retail sales through February was exaggerated.”
Of course, the March retail sales report out last week was led primarily by a pickup in auto sales as well as gasoline prices. (About 60% of the entire increase in retail sales came from these two components.)
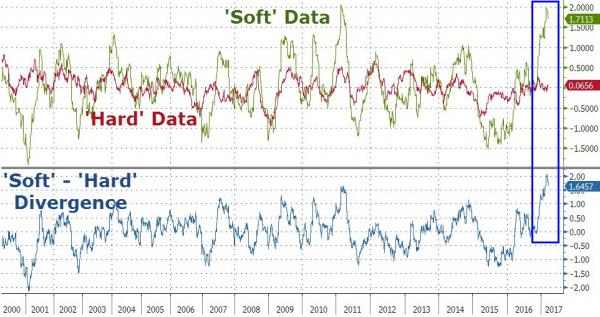
There is an interesting dichotomy currently occurring within the economy. While consumer confidence, as reported by the Census Bureau, soared to some of the highest levels seen since the turn of the century, the hard economic data continues to remain quite weak. As noted by Morgan Stanley just recently:
“Compare the New York Federal Reserve Bank’s current 1Q GDP tracking vs ours – FRBNY is currently tracking 1Q GDP at 3.0% versus us around 1%. The difference is larger than usual and is being driven by the fact that the New York Fed incorporates soft data into its tracking (attempting to tie it econometrically to GDP, a very hard thing to do especially in real-time). Our method translates the incoming hard data into its GDP equivalent. Note that the Atlanta Fed’s GDPNow tracking also focuses on hard data and is currently tracking 1% for 1Q GDP.”
![]()
Since then, estimates for Q1-GDP have drifted higher, but the point is the same and the stunning divergence can be seen in the chart attached to that same article which shows the difference between the “hard” and “soft” data specifically. (courtesy Zerohedge)
What is currently expected by those with a more “bullish bias” is the hard data will soon catch up with the soft data. However, optimism may be misplaced if the recent CFO survey is any indication:
The survey generated responses from more than 1,500 chief financial officers, including 469 from North America, and showed that:
- 67% of those surveyed predicted the U.S. economy would be in recession by the third quarter of 2020,
- 84% believe a recession will have begun by the first quarter of 2021; and,
- 38% of respondents predicted a recession by the first quarter of next year.
Event Horizon
Economic cycles do not last indefinitely.
While fiscal and monetary policies can extend cycles by “pulling forward” future consumption, such actions create an eventual “void” that cannot be filled. In fact, there is mounting evidence the “event horizon” may have been reached as seen through the lens of auto sales.
I recently discussed this point with my friend Simon Constable specifically. but the entire Video Cast is excellent.
He is right.
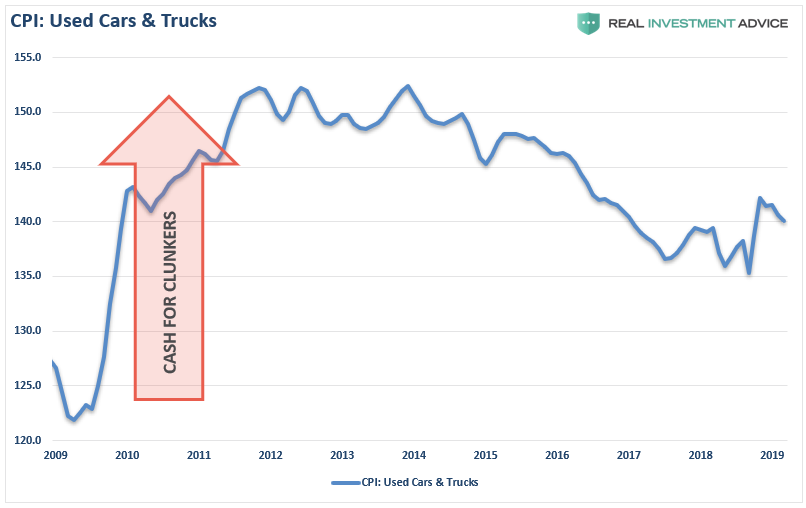
Following the financial crisis the average age of vehicles on the road had gotten fairly extended so a replacement cycle became more likely. This replacement cycle was accelerated when the Obama Administration launched the “cash for clunkers” program which reduced the number of “used” vehicles for sale pushing individuals into new cars.
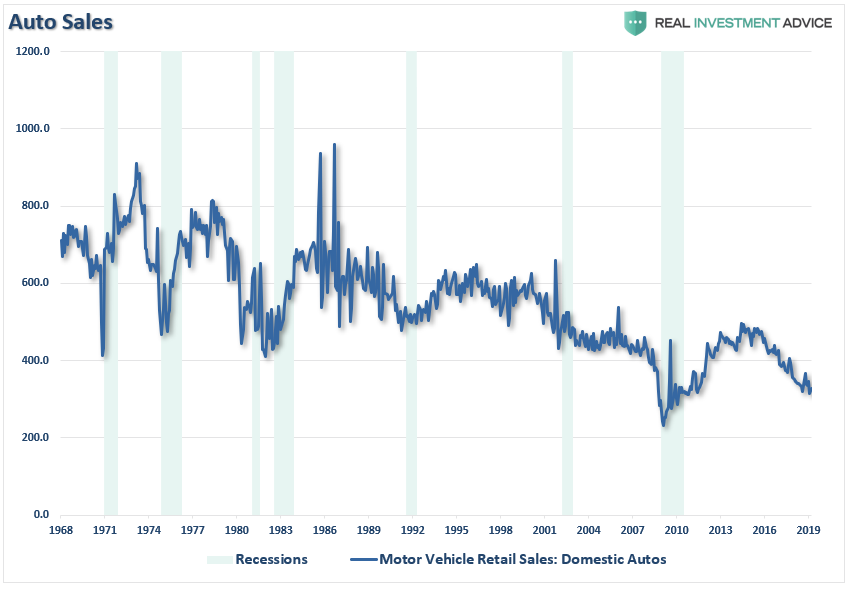
Combine replacement needs with low interest rates, easy financing, and extended terms and you get a sales cycle as shown below. The problem, as always, is there are only a finite number of people to sell to and once they have bought a car, they aren’t coming back for a while.
This is why auto sales are very cyclical in nature. Not surprisingly, due to the cyclical nature of autos, sales tend to flatten and decline as an economic recession approaches. (Note: When auto sales are reported each month they are annualized. The bar chart shows the over/underestimation of auto sales each month as compared to what actually occurred on an annual basis.)

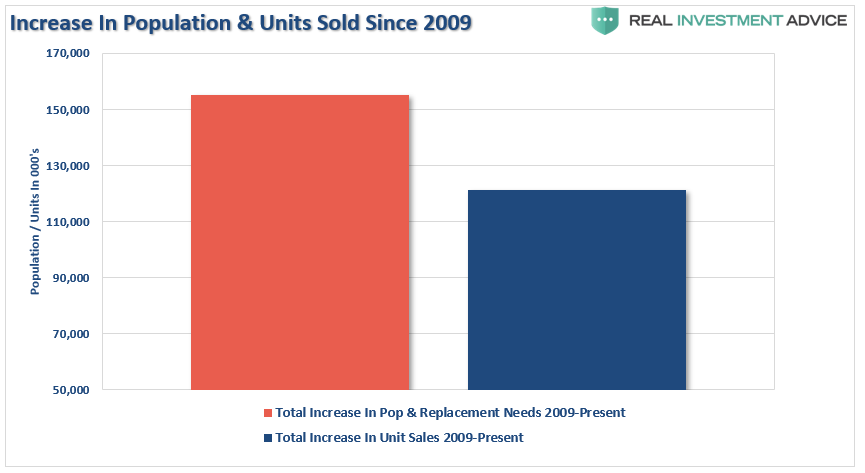
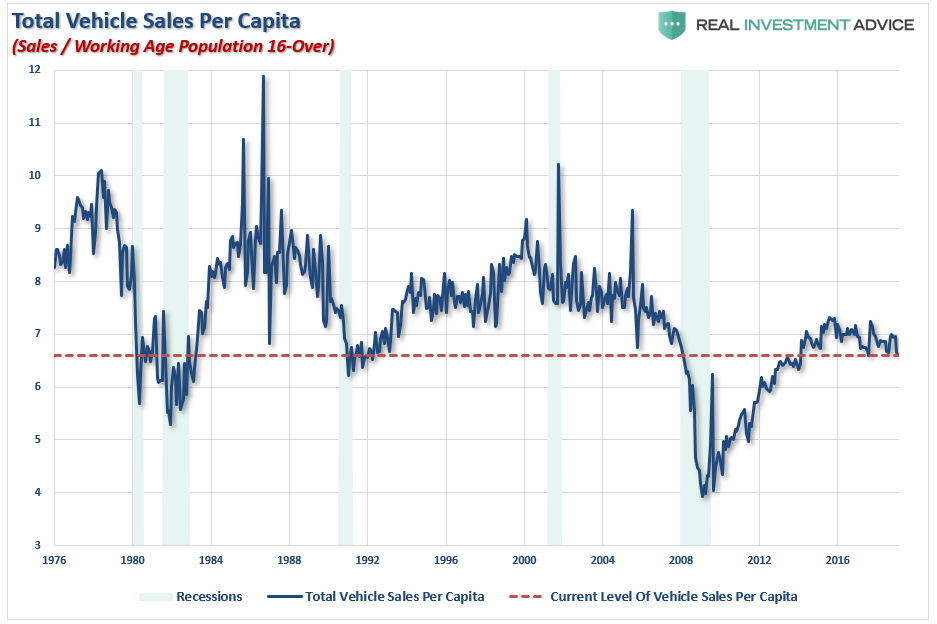
While the media touts the “jump in auto sales,” it is a far different story when compared to the increase in the population. With total sales only slightly eclipsing the previous record, given the increase in the population, this is not the victory the media wishes to make it sound. In fact, the current level of auto sales on a per capita basis is only back to where near the bottom of recessions with the exception of the “financial crisis.”
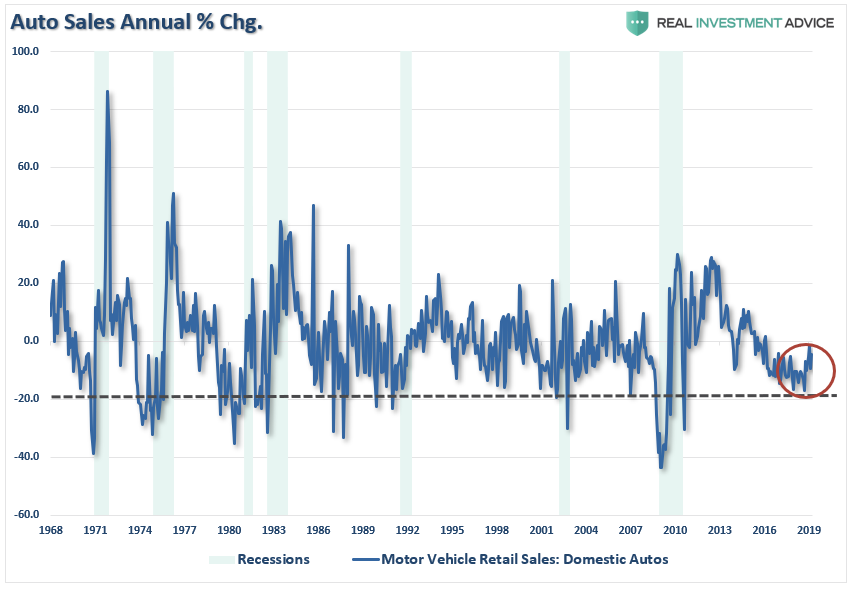
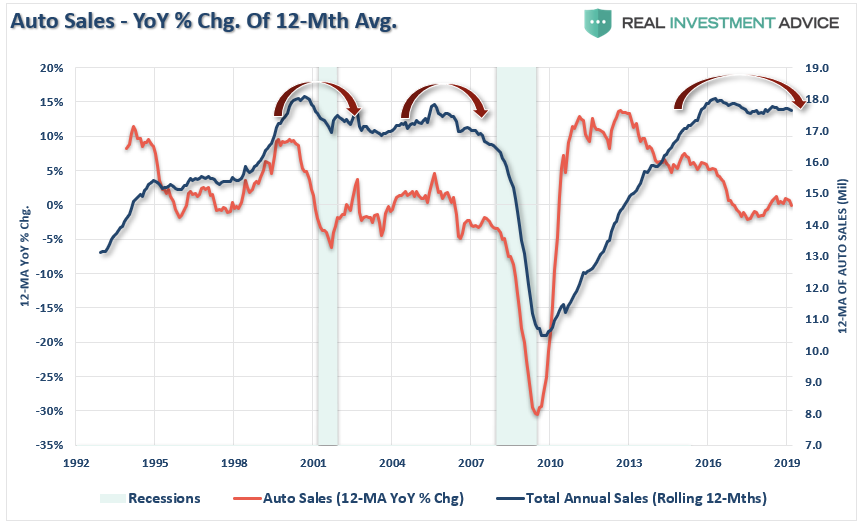
Furthermore, the annual rate of auto sales has slowed dramatically and is approaching levels normally associated with more severe economic weakness.
But slowing auto sales is only one-half of the problem. The problem for automakers is, as always, they continue to produce inventory even though demand is slowing. The cars are then shifted to dealers which have to resort to increasing levels of incentives to get the inventory sold. However, eventually, this is a losing game.
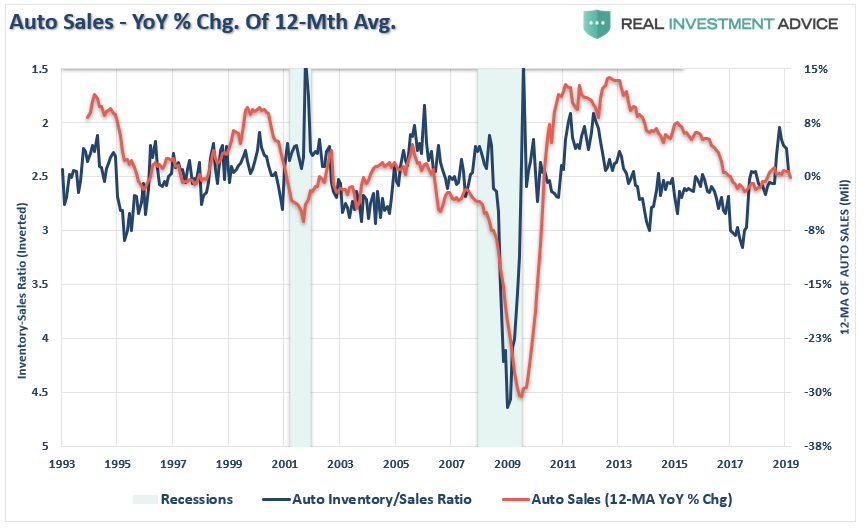
The chart below shows the current 12-month average of the annual rate of change in auto sales as compared to the inverted inventory-sales ratio. As you can see, there is a correlation to rising auto inventories and declines in auto sales. The current data suggests further weakness in auto sales coming.
With more and more dealers offering special incentives to lure buyers as demand slows, we are back to seeing commercials of “employee discounts,” “zero down at signing,” and “additional cash bonuses.” There is a limit to the level of incentives that dealers can provide to move inventory. Eventually, the inventory overhang will be problematic.
Data suggests that is happening now according to the Houston Chronicle:
“New car sales locally and nationally are falling as interest rates have soared and automakers have pulled back on incentives. Interest rates on new financed vehicles averaged 6.4 percent in March, the highest in a decade, according to Edmunds, a California-based automobile data provider.”
Subprime Returns
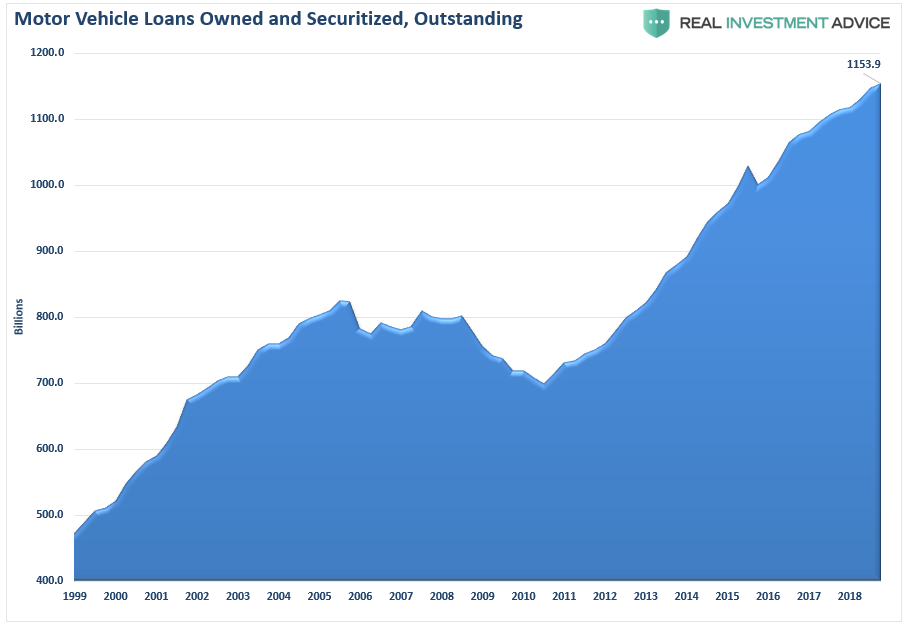
As we discussed in “People Buy Payments,” Americans are drowning in auto loan debt and changes in interest rates matter…a lot. A new report from the California Public Interest Research Group, or Cal-PIRG, finds the average car loan has increased 75% over the last decade. In all, Americans owe roughly $1.2 trillion in auto loans.
“Americans are taking out more loans, they are taking out much larger loans, and they are taking those loans out for a longer period of time,” said Emily Rusch, executive director for Cal-PIRG.
Given the lack of wage growth, consumers are needing to get payments down to levels where they can afford them. Furthermore, about 1/3rd of the loans are going to individuals with credit scores averaging 550 which carry much higher rates up to 20%. In fact, since 2010, the share of sub-prime Auto ABS origination has come from deep subprime deals which have increased from just 5.1% in 2010 to 32.5% currently. That growth has been augmented by the emergence of new deep sub-prime lenders which are lenders who did not issue loans prior to 2012.
“Recent dire warnings about practices in the subprime car loan industry have drawn comparisons to the 2008 mortgage crisis. In an interview with Bloomberg TV in 2017, investor Steve Eisman—who famously profited off the financial crisis by betting against the market—singled out the auto loan industry. ‘We are in an environment where credit quality has never been this good in anyone’s lifetime, with the one exception of subprime auto,’ said Eisman.
Those lending patterns are now being repeated: Many Wall Street lenders have been pushing auto loansaggressively on subprime borrowers on iffy terms. These loans are then spun up into bonds and sold to investors hungry for auto-loan-backed securities.”
While there has been much touting of the strength of the consumer in recent years, it has been a credit-driven mirage. With income growth weak, debt levels elevated, and rent and health care costs chipping away at disposable incomes, in order to make payments even remotely possible, terms are often stretched to 84 months.
The eventual issue is that since cars are typically turned over every 3-5 years on average, borrowers are typically upside down in their vehicle when it comes time to trade it in. Between the negative equity of their trade-in, along with title, taxes, and license fees, and a hefty dealer profit rolled into the original loan, there is going to be a substantial problem down the road. As noted by Reuters:
“Typically, car dealers tack on an amount equal to the negative equity to a loan for the consumers’ next vehicle. To keep the monthly payments stable, the new credit is for a greater length of time.
Over the course of multiple trade-ins, negative equity accumulates. Moody’s calls this the ‘trade-in treadmill,’ the result of which is ‘increasing lender risk, with larger and larger loss-severity exposure.’
To ease consumers’ monthly payments, auto manufacturers could subsidize lenders or increase incentives to reduce purchase prices, though either action would reduce their profits, the report said.”
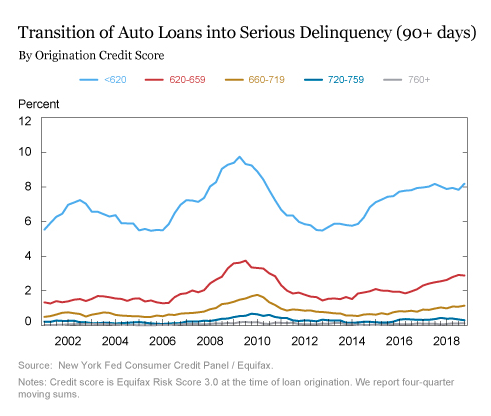
With more sub-prime auto loans outstanding currently than prior to the financial crisis, defaults rising rapidly and a large majority with negative equity in their vehicles, swapping out to a new car is becoming a near impossible option.
The Federal Reserve recently reported the number of borrowers with auto loans more than 90-days delinquent shot up by 1.5 million in the fourth quarter, reaching a total of 7 million — the highest mark ever in absolute numbers, though not as a percentage of the auto-loan market, which has ballooned over the past seven years.

Consumer pain tends to be a leading indicator for broader economic struggles: An increase in delinquencies could signify waning consumer health, foreshadowing a drop in confidence and an overall spending slowdown, which affects nearly every industry.
As reported by Business Insider:
“Bad consumer loans could also inflict losses on major institutions invested in the loans, which are packaged up and sold as asset-backed securities (ABS). That has the potential, if it gets out of hand, to create systemic risk, as we saw with mortgage-backed loans in the last crisis.
So ugly consumer data is a siren alerting investors, trauma-scarred from the mortgage meltdown, to the next proverbial canary in the coal mine.
The surge in auto defaults has been a source of both confusion and consternation. The Fed called the development surprising, and Goldman Sachs analysts referred to it as “something of a puzzle,” given the broader economic and labor-market strength, and the lack of distress in other consumer credit products, such as mortgages and credit cards.”
While the “cash for clunkers” program by the Obama Administration caused a massive surge in used vehicle prices due to the rapid depletion of inventory at the time, much of that inventory has now been rebuilt. Now, used vehicle prices are dropping sharply, as the market is flooded with off-lease vehicles and consumer demand is weakening.
As noted above, the issue of the “trade-in treadmill” is a major issue for auto lenders as default risk continues to increase. Per Moody’s:
“The percentage of trade-ins with negative equity is at an all-time high, as is the average dollar amount of that negative equity. Lenders are increasingly faced with the choice of taking on greater risk by rolling negative equity at trade-in into the next vehicle loan. We believe they are increasingly taking this choice, resulting in mounting negative equity with successive new-car purchases.”
And sales of new automobiles isn’t nearly as robust as media headlines purport.
Given the importance of automobiles to the domestic manufacturing sector of the economy, it is becoming apparent the sales of autos to consumers has reached an important inflection point.
The previous recessionary warnings from autos was dismissed until far too late. It is likely not a good idea to dismiss it this time.