CLICK ON CHART TO ENLARGE
Did the Hang Seng Index just create a “Double Top” at the same price it peaked in 2007? Let’s investigate!
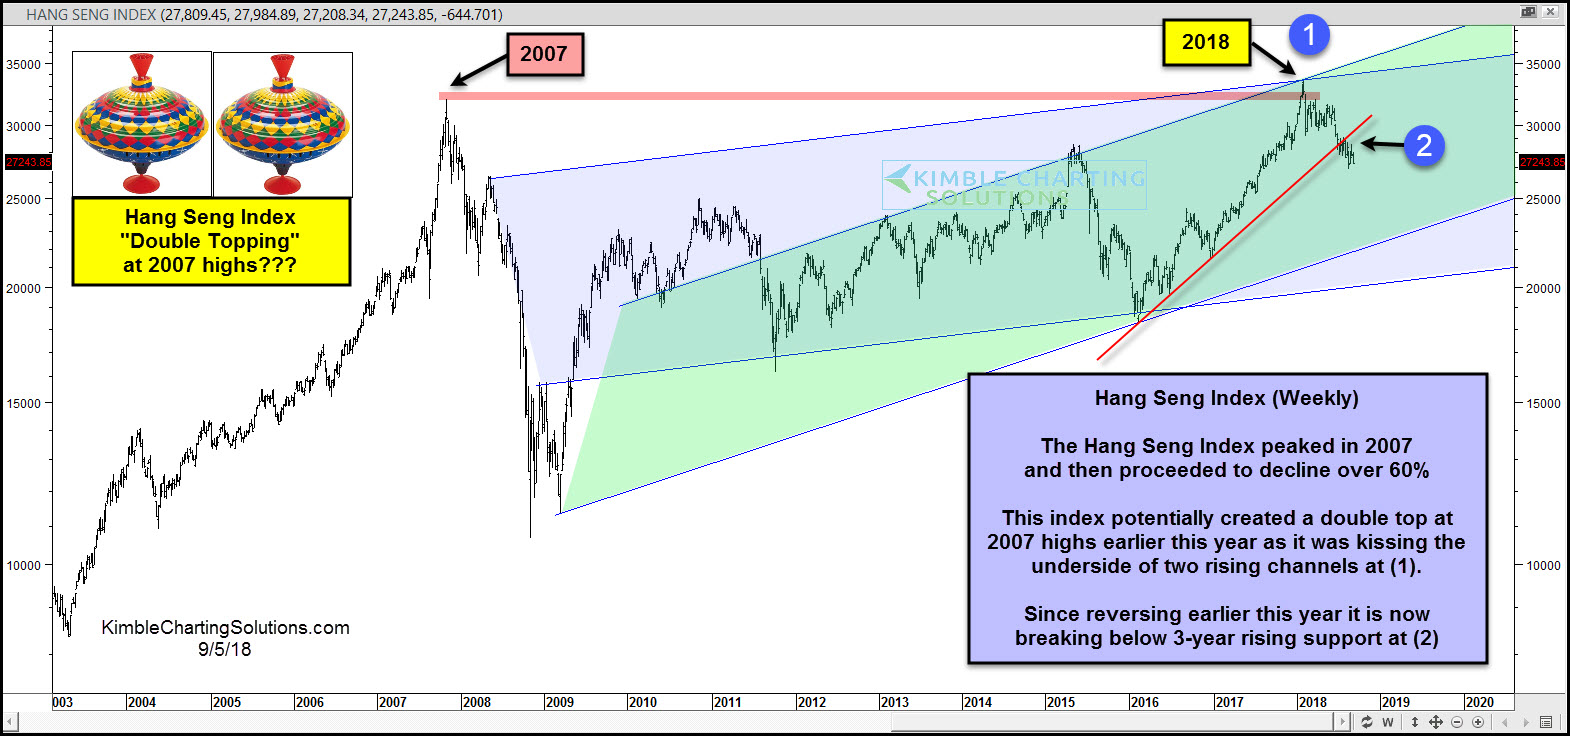
This chart looks at the Hang Seng Index on a weekly basis over the past 15-years. As you can see it peaked in 2007 and then proceeded to lose over two-thirds of its value. After the large decline, it created a double bottom/higher lows in 2009, where it started a new rising trend.
The 9-year rally off the 2009 lows saw it hit 2007 highs and the underside of two rising channels earlier this year at (1), where it might have double topped.
Since reversing at 2007 highs at (1), it is now breaking 3-year rising support at (2) and below 2015 highs.
Rising channel support off the 2009 lows comes into play around 22,000, around 20% below current prices. Keep a close eye on this key index as weakness in China could spill over into the states!