Wolf Richter wolfstreet.com, www.amazon.com/author/wolfrichter
The “yeah but” shows up again.
The services sector, which accounts for about 70% of the US economy – the biggest segments being finance and insurance, healthcare, professional services such as architects, engineers, and lawyers, and information services such as telecom and data processing – has been growing at a fairly decent level, unlike manufacturing. All eyes are now on services to see whether they can keep pulling the US economy forward a while longer.
This morning, we got a boots-on-the-ground view from executives in that sector, surveyed by the Institute of Supply Management. The ISM Non-Manufacturing Index rose 1.4 points to 56.9%, the strongest reading in three months. A value below 50 indicates decline. A value above 50 indicates growth. The higher the value, the faster the growth. The May reading is well in the range since 2011, but not as high as during most of 2018, which had been red-hot (horizontal blue line = May level):
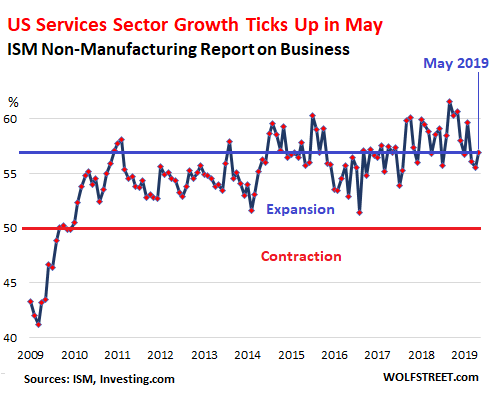
Among the sub-indices that showed growth that is increasing: The Employment Index jumped 4.4 percentage points to 58.1%; Business Activity/Production rose 1.7 points to 61.2; the New Orders Index ticked up 0.5 percentage points to 58.6%.
Among the sub-indices that showed growth, but at a slower rate: Backlog of orders index ticked down 2.5 points to 52.5%; and New Export Orders ticked down 1.5 points to 55.5%.
Imports showed no growth, at 50.0, having dropped five points from 55.0 in April.
Of the 17 non-manufacturing industries covered by the ISM, 16 reported growth in May, in order of growth:
- Accommodation & Food Services;
- Educational Services;
- Management of Companies & Support Services;
- Construction;
- Transportation & Warehousing;
- Real Estate, Rental & Leasing;
- Utilities;
- Wholesale Trade;
- Public Administration;
- Professional, Scientific & Technical Services;
- Mining;
- Health Care & Social Assistance;
- Other Services;
- Finance & Insurance;
- Information;
- Retail Trade.
Only one of the 17 non-manufacturing industries showed a decrease in economic activity in May: Agriculture, Forestry, Fishing & Hunting.
The ISM report explains that historically, a value of the Non-Manufacturing Index over 48.6% “generally indicates an expansion of the overall economy.” With the May index at 56.9, the ISM report estimates that the overall economy, as measured by real GDP (adjusted for inflation) on an annualized basis, grew at a rate of 2.9% in May.
This estimate is up from the April report, which had been slightly less strong, indicating that real GDP in April grew at an annual rate of 2.4%.
Yeah, but…
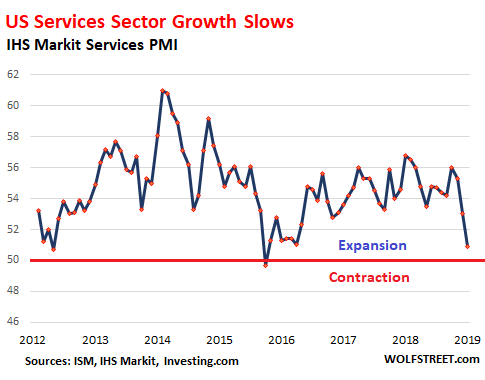
The IHS Markit US Services PMI was also released this morning. The data only goes back to 2010 and is narrower than the ISM Non-Manufacturing Index, covering only consumer services (but not retail), transportation, information, communication, finance, insurance, real estate, and business services.
Its headline reading for May dropped to 50.9 (above 50 = expansion), indicating growth but sharply slowing growth. Since Markit’s data only goes back to 2010, we don’t know what the index might have shown during the Great Recession. Note that the index dipped below the 50 line (into contraction mode) in February 2016, when growth in the overall economy was slowing but not enough to register a recession:
Service firms keep hiring and increasing their staffing levels: “A sustained increase in new work drove firms to employ greater workforce numbers,” the report finds. “The rise in staffing levels was stronger than that seen in April and moderate overall.” Some other details:
- Some firms “stated that greater competition and softer demand conditions had, in part, driven the slowdown.”
- New orders “increased at only a marginal rate in May.” And “new export orders were broadly unchanged” (at 50.0).
- “Business confidence was at its lowest level since June 2016 as service providers highlighted concerns surrounding softer demand conditions and uncertainty around ongoing global trade tensions.
- Backlogs of work remained the same as in April.
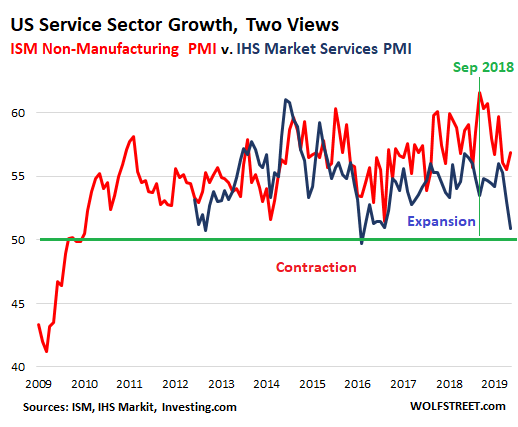
So what to make of these two diverging data sets — the ISM Non-Manufacturing Report on Business and the IHS Markit Services PMI? They rarely agree, and they have diverged strongly before, including in September 2018, when the Market PMI (blue) dropped to 53.5, while the ISM Index (red) soared to what was at least a decade high of 61.6:
These indices are based on responses by industry executives (the “panelists”) on a monthly basis. They’re a quantified boots-on-the-ground view of their industry that is more immediate than economic data often reported months after the fact. The names of the companies and the panelists are not disclosed.
It would be nice to get pleasantly consistent economic data. But we normally don’t. So we got additional data points today that show the services sector is growing, but the range for May is somewhere between a slow rate of growth and a decent but not spectacular rate of growth.