Stock prices hit an all-time high in October 2007, when the latest GDP data showed nearly 4% second-quarter growth. Equally strong third-quarter GDP growth, released later that month, was revised up to almost 5% a month later. This was right on the verge of the Great Recession, which began in December 2007.
Nor did this illusion of strength go away as stock prices continued their decline.
In June 2008, half a year inside the recession, Fed Chairman Ben Bernanke declared that the risk of a “substantial downturn appears to have diminished,” stressing the “the upside risks to inflation” instead. The futures markets agreed wholeheartedly, betting on more than a full percentage point of Fed rate hikes by year-end. This was smack in the middle of what turned out to be the worst recession since the Great Depression.
When Lehman Brothers collapsed in August 2008 – nine months after the Great Recession began – the GDP data showed it rising in every single quarter since 2001, barring a miniscule dip at the end of 2007. Those numbers were downgraded only after the recession ended, with much of the revisions coming years later.
Today’s GDP data is also likely to be exaggerating the economy’s strength. Indeed, since GDP tends to be substantially revised years after the fact, it’s useful to cross-check it with the data on Gross Domestic Income (GDI), an equivalent measure of output growth, based on income rather than purchases. Importantly, one study showed that initial GDP growth estimates tend to get revised toward initial GDI growth estimates, but not vice versa.
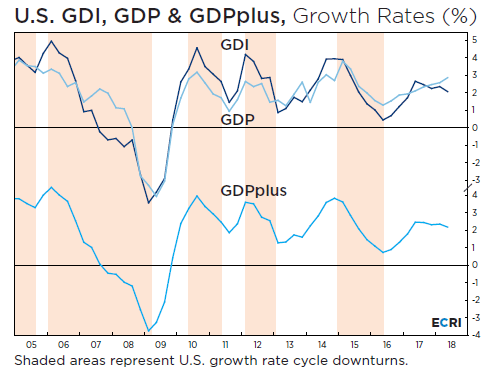
So it’s surely worth noting that, in the second quarter of 2018, GDI grew at a scant 1.6% pace, far below the 4.2% GDP growth rate.

Indeed, while year-over year (yoy) real GDP growth has been rising steadily, and has climbed to a three-year high (upper panel, light blue line in chart), yoy real GDI growth has been in a yearlong slowing trend, declining to a 1¼-year low (dark blue line).
Both real GDP and real GDI have shortcomings. Therefore, the Philadelphia Fed – regarding both as “noisy indicators of true, underlying, latent” real output – extracts from them an “optimal estimate” called GDPplus.
Like yoy real GDI growth, yoy GDPplus growth has been in a shallow cyclical downswing for a year, and has just touched a 1¼-year low (lower panel). This narrative stands in stark contrast to headlines heralding accelerating GDP growth.
At the same time, the unemployment rate, which declines substantially in long expansions – especially when demographics slow labor force growth – hasn’t been this low since 1969. But few understand a key reason for its decline: the enormous increase over the decades in the proportion of college graduates, whose jobless rates are always much lower.
Today, over 34% of Americans are college graduates, over triple their 1969 population share. But those lacking high school diplomas – nearly half the 1969 population – make up only a tenth of the population now. Notably, their jobless rate is usually double to over quadruple that of college graduates, who are now far more numerous and thus pull down the headline jobless rate.
College graduates’ unemployment rate is now the lowest since 2007, not 1969, while their share of overall wages is well over half, having doubled since 1969. But the wage share of those without high school diplomas – which equaled that of college graduates in 1969 – has plunged to under 4%, meaning that their plummeting jobless rate since 2010 offers hardly any support to consumer spending.
Since GDPplus is a better measure than GDP or GDI, its sobering message is worth heeding. And while the headline jobless rate is the lowest since the 1960s, for college graduates it was lower as recently as 2006.
As Mark Twain observed, there are lies, damned lies, and statistics. That’s why it’s really important to cross-check, and cross-check again, to get at the truth buried under the headlines. And in this case, the reality is that economic growth is slowing, not speeding up.