by Dana Lyons

Big down months off of highs have led to bear markets in the past.
Everything was going just fine for investors at the end of September (well, maybe not under the surface). The major averages closed right near all-time highs, just in time for quarterly 401(k) statements. Then October happened and, well, you know…a nearly double digit drawdown intra-month in the Dow Jones Industrial Average (DJIA) and an eventual loss of more than 5% for the month. But, that’s just one bad month, right? Not the start of a new trend or anything? Certainly, only the future knows the answer to that. However, the past may suggest that it may be more than a 1-month hiccup.
Why do we say that? Take a look at the 14 other months in the past 100 years when:
- The DJIA set a multi-year high one month, then
- Suffered at least an 8% intra-month drawdown and closed down at least 4% the next month.
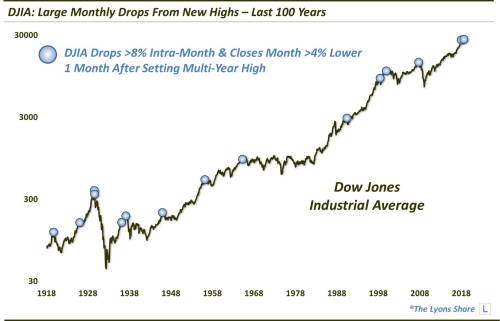
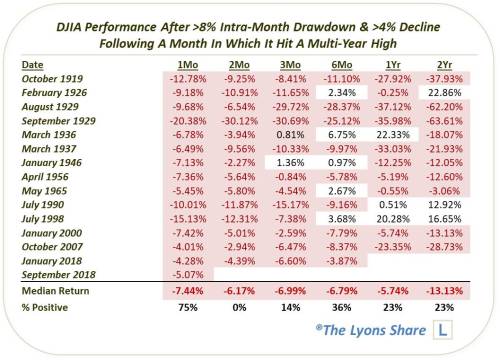
Now, we’ll show the months and aggregate performance in the table below. However, the best message is probably drawn by a glance at the chart above and the inordinate number of significant tops marked by such month “rug pulls” — including cyclical tops in 1929, 1937, 1946, 1965, 2000 and 2007. (The 1-month return signifies the drawdown month).
So will history repeat again in 2018? It remains to be seen. We certainly aren’t going to hang our hat on this single data point. However, it does fit with much of our other analysis and, because of that, we would not put it past the bears to form another significant top here.