In April, an op-ed in The Wall Street Journal titled “So Long, California. Sayonara, New York,” published by conservative economists Arthur Laffer and Stephen Moore, warned about a provision within the brand- new tax bill that could trigger a mass migration of roughly 800,000 people — fleeing California and New York for low-tax states over the next several years.
Laffer and Moore said capping the deduction for state and local taxes (SALT) to $10,000 will accelerate the velocity of the migration of high-income earners from New York and California to regions like “Arizona, Nevada, Tennessee, Texas, and Utah.”
Now that the SALT subsidy is passed, how bad will it get for high-tax blue states, and more specifically New York?
New evidence suggests that New York City could be the first visible region where the mass migration could begin. Take, for example, the number of homes listed for sale in Manhattan, Brooklyn, and Queens had a parabolic spike in May, with inventory across 60 percent of the boroughs reaching all-time highs, according to the latest StreetEasy Market Report. While residential inventory traditionally peaks at the end of May, this year — the supply set new record highs and could continue through summer.
Laffer and Moore’s prophecy (above) of the great migration from New York — triggered by Trump’s new tax bill could be the most logical explanation of why NYC homeowners are rushing all at once to sell their homes.
Housing inventory in Manhattan rose 16.7 percent compared to last year, the largest y/y increase on StreetEasy record. Brooklyn and Queens saw similar spikes, with inventory up 23.4 percent and 42.8 percent, respectively.

With housing inventory piling up across much of the boroughs, the total number of sales declined for the third consecutive month. StreetEasy said sales plummeted in every submarket across Brooklyn, Manhattan, and Queens; with more significant declines visible in the Upper East Side, Midtown and the Rockaways. Despite the flood of new inventory threatening to stall the market, the StreetEasy Price Index advanced in all three boroughs since last year.
“Sellers are betting on a wave of demand from the peak shopping season, but this summer’s market has turned out to be a crowded one,” says StreetEasy Senior Economist Grant Long.
“However, prices are high and continue to rise. More affordable homes are the hardest to find, and are sure to sell quickly. But higher-end homes, particularly those joining the market from the ongoing stream of new development, will be pressured to lower prices or linger on the market.
This summer is poised to offer an excellent negotiating opportunity for buyers with big budgets.”
As Bloomberg notes, the abnormal amount of supply hitting the NYC residential markets is not sufficiently being met with demand, which could eventually be problematic for prices and serve as a potential turning point. Recently, the mainstream media cleverly changed their narrative and called the ‘housing shortage,’ a ‘housing affordability crisis,’ as it sure seems that the housing bubble, or whatever you want to call it, is in the later innings.
* * *
See below for more StreetEasy trends across Manhattan, Brooklyn, and Queens:
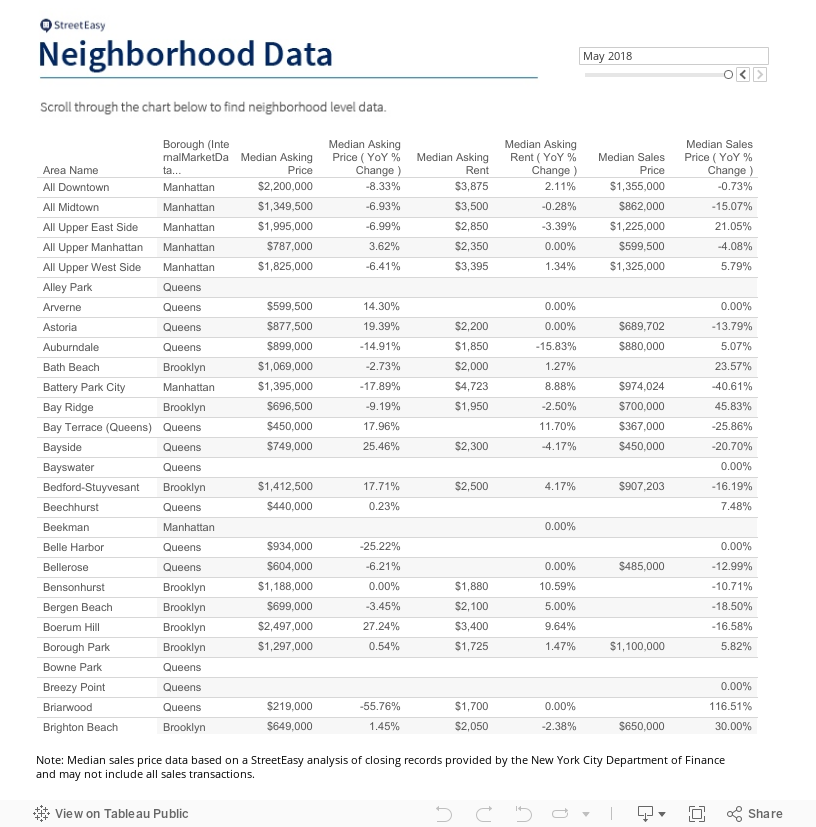
May 2018 Key Findings — Manhattan
- Sale prices rose in all submarkets but one. The StreetEasy Manhattan Price Index increased 0.6 percent to $1,157,995. Prices rose in four of the five submarkets, led by an increase in the Upper East Side, where the median home price rose 1.9 percent to $1,038,046. Prices in Downtown Manhattan remained flat at $1,691,204.
- Inventory rose at a record pace. Sales inventory in Manhattan rose 16.7 percent year-over-year. The Upper East Side experienced the largest increase, with inventory up 20.2 percent since last year.
- One out of every six homes received a discount. Sixteen percent of homes for sale were discounted, an increase of 3.6 percentage points year-over-year.
- For-sale homes spent less time on the market. Units in the borough spent a median of 55 days on the market, a three-day dip from last year. The Upper East Side and Upper West Side were the only submarkets where homes lingered longer — up 10 days and 17 days, respectively.
- Rents rose in every Manhattan submarket. The StreetEasy Manhattan Rent Index [iv] rose 1.4 percent to $3,183. Rents in Upper Manhattan rose the most — up 2.5 percent to $2,307.
- Fewer rentals offered a discount. Sixteen percent of rentals in Manhattan were discounted in May, a decrease of 1.6 percentage points from last year.
May 2018 Key Findings — Brooklyn
- Prices reached new highs in North Brooklyn. The StreetEasy North Brooklyn Price Index increased 11.1 percent to $1,229,838, a record high for the submarket despite the looming L train shutdown. Borough-wide, prices rose by just 1.1. percent since last year, to $720,555.
- The number of homes with a price cut reached an all-time high. The share of sales with a price cut reached an all-time high of 12.4 percent, a rise of 3.3 percentage points from May 2017.
- Sales inventory continued to climb, except in North Brooklyn. Sales inventory in the borough reached a record high — up 23.4 percent over last year. Inventory rose the most in South Brooklyn, which saw a 44.7 percent increase over last year. North Brooklyn was the only submarket where inventory dropped, by 6.7 percent since last year.
- Brooklyn homes spent more time on the market. Homes stayed on the market for a median of 53 days in the borough, 6 more days than last year. North Brooklyn homes are coming off the market after an average of 43 days — 26 days faster than last year.
- Rents rose in all submarkets except North Brooklyn. The StreetEasy Brooklyn Rent Index increased 1.4 percent year-over-year to $2,562. South Brooklyn experienced the largest spike: up 2.6 percent to a median rent of $1,885. North Brooklyn was the only submarket where rents stagnated, likely because of the L train shutdown starting in April 2019. Rents in the submarket remained flat at $3,062.
May 2018 Key Findings — Queens
- Price cuts rose to an all-time high. The share of homes with a price cut reached a new high in Queens at 11.1 percent, an increase of 3.5 percentage points over last year.
- Sales inventory swelled. Queens saw the largest year-over-year increase in inventory, rising 42.8 percent. All five submarkets in the borough saw a surge in inventory.
- Queens homes are selling slightly faster than last year. The median number of days on market for Queens homes was 56, down 2 days from last year. Homes in Northeast Queens and Northwest Queens took longer to sell than last year, with an increase of 12 days and 6 days on the market, respectively.
- Rents remained flat. The StreetEasy Queens Rent Index held at $2,113. But rents in South Queens rose 6.9 percent year-over-year, to a median of $1,775.
- Queens was the only borough with an increase in the share of discounted rentals. Seventeen percent of Queens rentals offered discounts: up 2.9 percentage points over last year, and the highest share of the three boroughs analyzed.