by Dana Lyons

When considering difficult math problems, it is, at times, easier to work backwards. Start with the answer and work your way back. So it can be with various charting techniques as well. That includes one of our favorite forms of analysis — Fibonacci — as we demonstrate in today’s Chart Of The Day.
Fibonacci represents a mathematical sequence found in many areas of life, including nature and financial markets. In the markets, we often see prices “retrace” portions of moves in magnitudes consistent with key Fibonacci levels. And sometimes we can identify key potential support levels on charts — and then measure potential targets, or tops, based on the Fibonacci sequence. For example, take a look at what this technique may be suggesting regarding a major long-term top in the world’s most famous equity index.
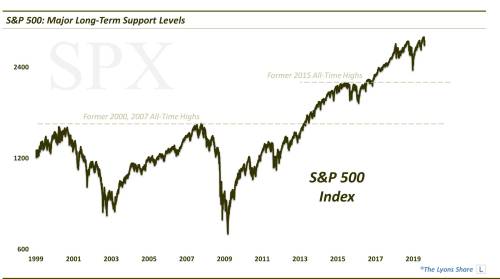
If we look at a chart of the S&P 500 (SPX), it is fairly easy to spot the most obvious few levels of long-term potential support. First off, the former all-time highs in 2000 and 2007 in the mid-1500 range. And secondly, the former highs in 2015 near 2130 or so.
Now comes the interesting part. Consider the cyclical rally in the SPX from a low in the mid-600’s in 2009 to the recent high around 3025. If we measure the most important Fibonacci Retracement of that rally, 61.8%, it lands right on those 2000 and 2007 highs in the mid-1500’s. Furthermore, the second most important Retracement level, 38.2%, yields the 2130 level which marked the 2015 highs. And, incidentally, that also implies that the 61.8% Fibonacci Retracement of the rally from the 2013 breakout above the 2000-2007 tops to the recent high also falls right on that 2130 level.
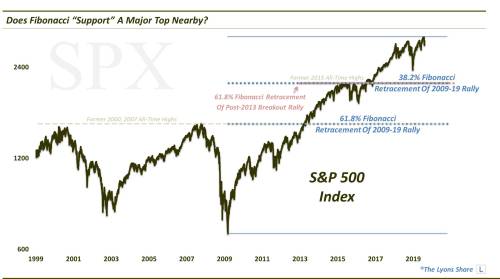
Is this voodoo analysis? Some might say so, but it’s really just a mathematical sequence. Is it a coincidence? Not likely as we have found the Fibonacci sequence to be far too reliable far too many times to label this scenario a coincidence. Does it guarantee that the recent highs in the S&P 500 marked a major long-term top? Of course not.
However, we don’t believe the pattern is a coincidence. And if the proximity of these important Retracement levels to the most obvious and important superficial long-term support levels on the chart of the S&P 500 is not by chance, then the index may just be forming a major top nearby.