via medium:
I believe I can prove that LendingClub.com, the largest peer-to-peer loan platform, has for years been rating loans with systematic bias. Some borrowers are rated lower risk than they should be, and others are rated higher risk than they should be.
Cause for Suspicion
My investigation began with a simple question: Why do hedge funds get consistently high returns from peer to peer lending, while retail investors often report vastly lower returns using the same platform? For instance, the Prime Meridian Income Fund keeps emailing me this graph of their fund’s absurdly good returns from peer to peer lending:

How do they do this? According to them, they use “proprietary credit algorithms to overweight the best risk/reward loans”. In other words, at least some of the lending platforms do a poor job of rating their loans, and this fund developed an algorithm that rates loans correctly in order to exploit these inefficiencies.
So if the hedge funds are able to disproportionately stack their portfolio with loans that perform better than average, who gets stuck with the rest of the loans performing worse than average? That would be you and I, my friend: those of us who simply turn on the automatic investing, and let LendingClub diversify us across all the loans. Investing in all the loans will always lose compared to an algorithm that beats LendingClub’s own risk assessment methods, especially if rich hedge funds are scooping up all the best loans shortly after they appear.
It is easy to find people complaining about poor returns at LendingClub, although it is difficult to prove anything from these anecdotes. So what can we prove? A lot, as it turns out, using LendingClub’s own publicly available data.
Loan Grading Basics
LendingClub rates loans from A1 (the least risky, having the lowest interest rate) down to G5 (the most risky, having the highest interest rate). In general, loans rated A1 can be expected to default¹ slightly less than those rated A2, which default slightly less than those rated A3, and so on. This rating system basically works:
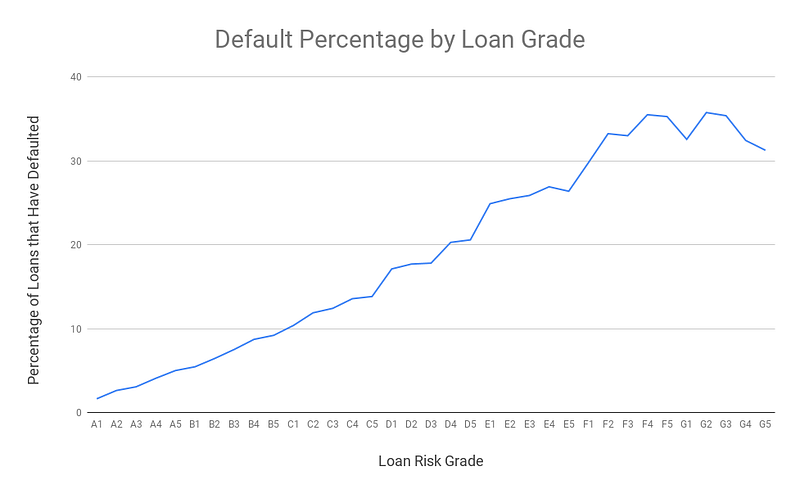
Things appear to break down when we get to the highest risk loans, but we have not yet accounted for some loans being paid off earlier than others. We will discuss early payoffs more later, but for now here is the same chart adjusted for the risk of early payoffs:
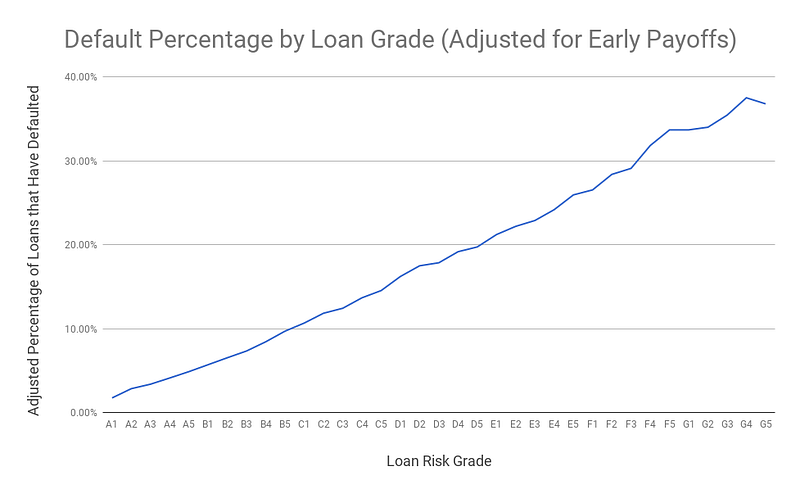
Clearly the rating system basically works. However, we will find that many loans are several grades off from where they should be. Something rated B1 might actually be very low risk, and should have been rated A3. Something rated B3 might actually be much higher risk, and should have been rated C1.
Mortgage or Rent?
One of the biggest factors in most people’s credit score is whether they have a mortgage. Let’s start there. I’m sure LendingClub already takes this into account when they grade loans . . . right?
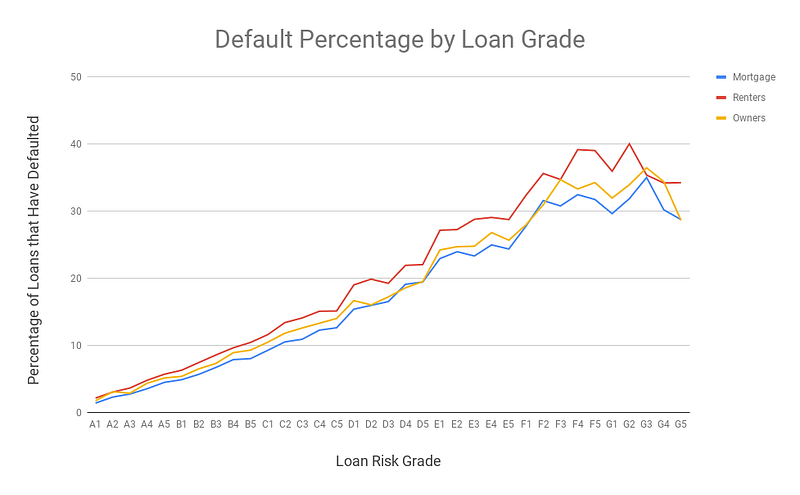
WHAT?! Renters default more than people with a mortgage in every single grade! Let’s take a closer look at the data. In the graph above, the effect appears to be smaller for the grade-A loans, but that is deceptive. A1 borrowers with a mortgage have a 1.45% chance of default, whereas A1 renters have a 2.19% chance of default. That means A1 renters are 51% more likely to default! The graph below illustrates this across all grades:
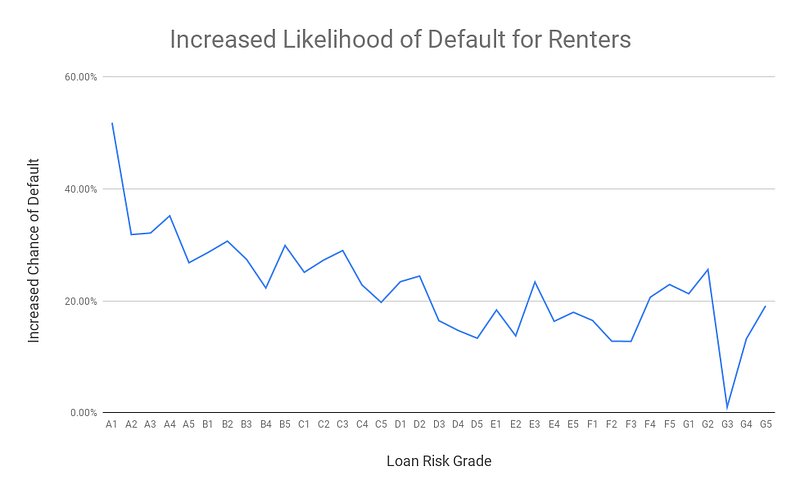
Across all loan grades, being a renter increases the risk of default by an average of 26% compared to people having a mortgage. Before we get out the pitchforks, let’s see if LendingClub has fixed this. After all, we’re looking at more than 10 years of data. Perhaps this problem happened in older loans but is no longer an issue.