via upfina:
The year over year core PCE price index was up 1.955% in May. If you round the data up, the Fed has finally reached its target for 2% inflation. This means it beat out expectations by about half of a basis point since the expectation was for 1.9%. It was higher than last month’s report of 1.81%. The month over month core PCE and headline PCE price indexes showed 0.2% growth which met estimates. Finally, the headline PCE price index was up 2.3% because of higher oil prices.
The core PCE is one of the lowest measures of inflation as the core PPI is at 2.4% and the core CPI is at 2.2%. The core PCE being at or above 2% is so rare that it has only occurred 4 months in this 9 year expansion. The hope for those who want inflation to keep increasing is that the rate will stay high, unlike the bouts of inflation in early 2012 and mid to late 2016 because the labor market is tighter and the supply chain is overheated as evidenced by the regional Fed manufacturing surveys. The bears on inflation will point out that the year over year comparisons in core PCE were helped by easy year over year comparisons just like the other short-term increases in previous years. As you can see from the Macrobond chart below, the inflation rate in May 2017 fell to 1.48%. The comparisons will stay easy for the next 3 months until the core PCE growth in 2017 bottoms at 1.3% in August. If you look at a 2 year stacked growth rate, the April report showed 3.39% growth and the May report showed 3.43% growth, not much of a difference.
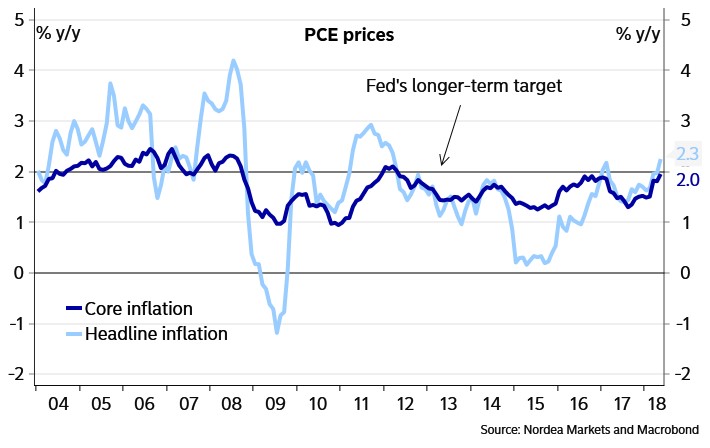
Source: Macrobond
What Does This Mean?
For core PCE growth to hit 2% was long in the making for those whose goal it was to reach it, namely the Fed. After finally achieving its goal, the Fed won’t change anything because it has already stated it will have a symmetric policy. This means the average for the cycle should be 2%. The 2% target won’t act as a ceiling which means the Fed won’t hike rates quickly when it reaches its goal. For the Fed to run a contractionary monetary policy because it needs to solve an inflation problem, the core PCE needs to be above 2% for a sustained period or come close to threatening 3% in the short run. Keep the Thomson Reuters chart below in mind when worrying about this risk as the only time core PCE sustained above the Fed’s 2% target in the past 20 years was a 4 year period from September 2004 to 2008.

Source: Thomson Reuters Financial
Clearly, you can’t just look at the core PCE to determine policy because rates were at zero when it was above the goal in 2012. Secondly, when the core PCE took a sharp dive lower in 2017, the Fed still raised rates 3 times. Further evidence that this target achievement doesn’t mean much is the Fed funds futures. The chance of at least 4 hikes this year didn’t move after the PCE report came out. The Fed’s current guidance is for 4 hikes and the current odds show there’s a 45.3% chance of 4 hikes. If the tariffs slow the economy down, the Fed may switch back to 3 hikes since it has noted the risk of a trade war in past Minutes.
Where Is Inflation Headed?
Nominal wage growth could put pressure on inflation since weekly earnings growth is 3% which is near the cycle peak of 3.4%. Since oil prices are at their highest point since November 2014, it seems likely that headline inflation will be pushed higher in the June report. As we mentioned earlier, the year over year comparisons for core PCE are easy for the next 3 months. The chart below shows virtually every inflation measurement is increasing as the Atlanta Fed core sticky CPI, the Cleveland median CPI, the core CPI, the Dallas trimmed mean PCE, and the NY Fed underlying inflation gauge have all moved higher.
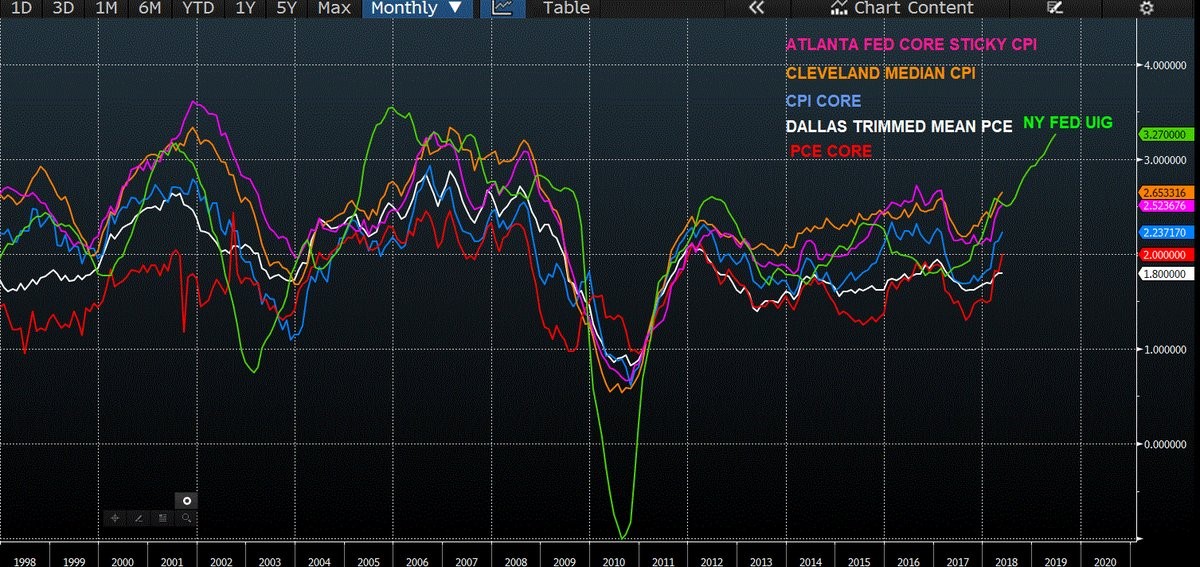
Source: Twitter @JulianMI2
The NY Fed UIG is moved forward because it has predictive power. Keep in mind, the UIG measurement includes food and energy as it is most closely associated with the CPI report, not core CPI. The NY UIG expects CPI inflation to be between 2.3% and 3.3%. The latest CPI reading of 2.8% shows it is in the middle of the range.
Housing Driving Inflation
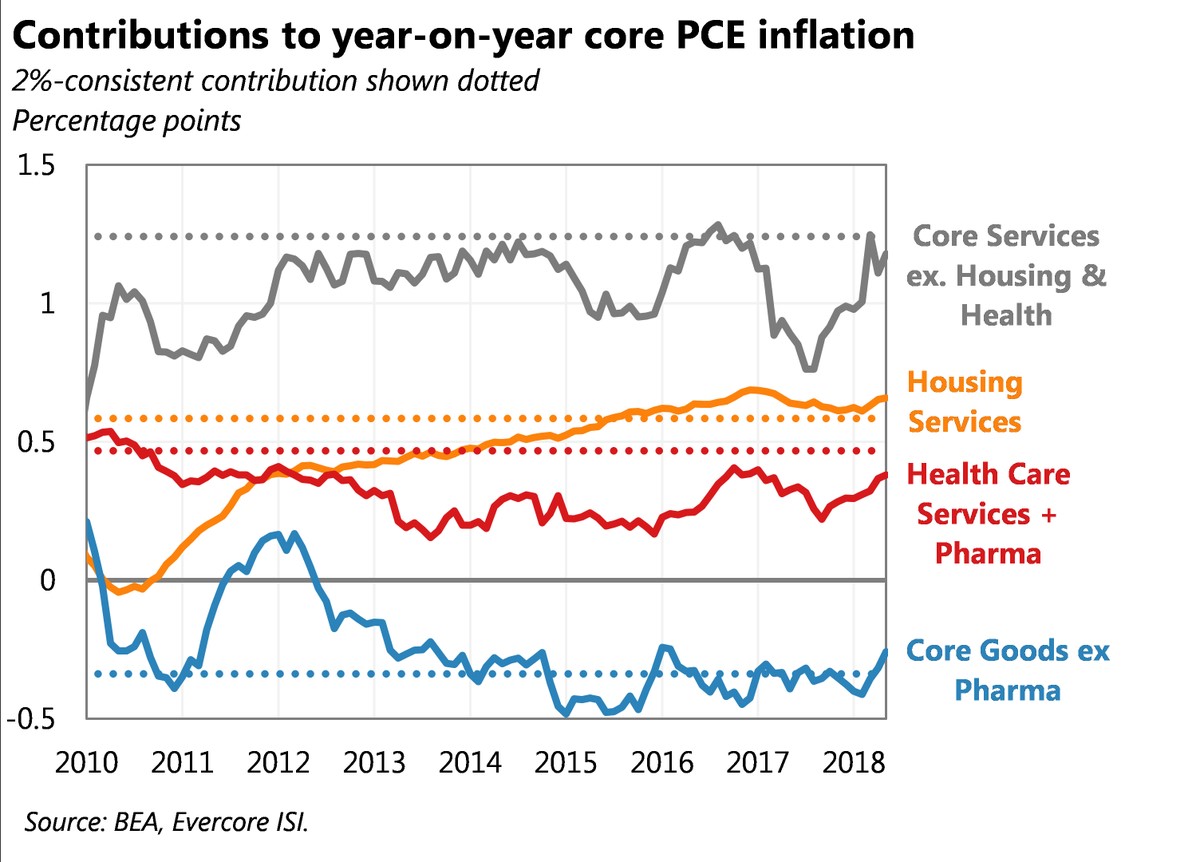
Headline inflation being driven by high oil prices is similar to how the core inflation rate is being driven by housing costs. The seasonally adjusted Case Shiller housing price index was up 6.4% in April 2018. As you can see from the chart below, housing services is the only category in the core PCE which has been consistently pushing inflation towards the Fed’s 2% goal.
Source: Twitter @ernietedeschi
Why get excited by this 2% inflation achievement if the main reason housing prices are going up is because of building restrictions? The Fed loves to contextualize data which is why it looks at inflation excluding food and energy. It would seem logical to avoid setting macroeconomic policy based on changes to the housing market which have little to do with monetary policy, namely city specific regulations. For example, the regulations on multifamily housing need to be changed to allow more affordable housing to be built in big cities like San Francisco. As you can see from the map below, it’s illegal to build apartment buildings in 78.6% of the city. The red zones in the map are where apartments can’t be built. This of course affects housing prices and affordability.
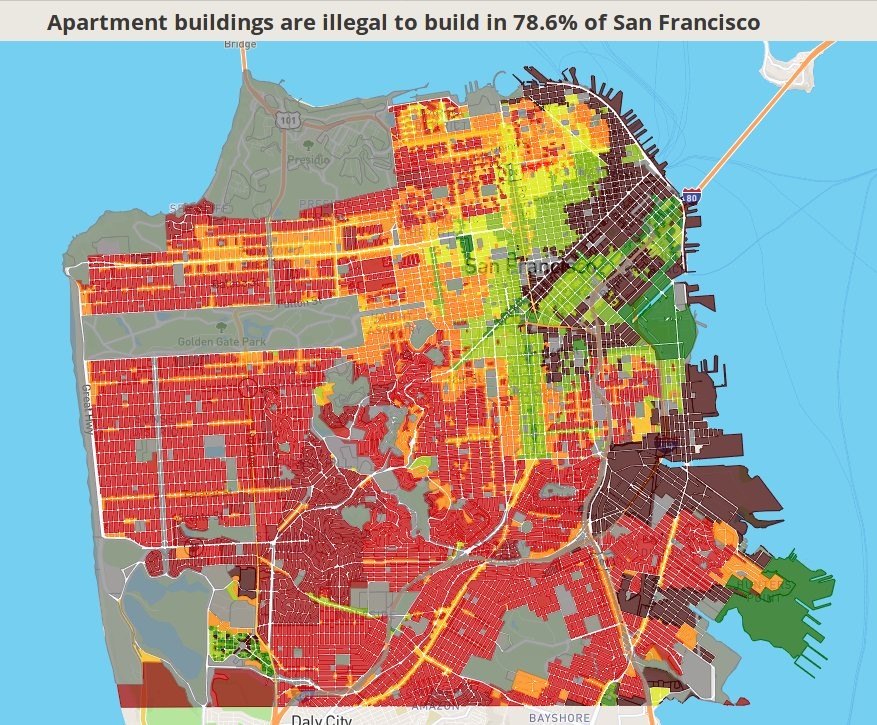
Source: Twitter @SonjaTrauss
Conclusion
The core year over year inflation increased 1.45 basis points from last month which isn’t a shock because of the easy comparison. Commentators are making a big deal about this because if you round up, the rate has finally reached the Fed’s 2% target. However, the Fed doesn’t view this as mission accomplished because it wants the inflation rate to average 2%.