From Frank Holmes at Frank Talk:
The annual “In Gold We Trust” report by Liechtenstein-based investment firm Incrementum is a must-read account of the gold market, and its just-released chartbook for the 2018 edition is no exception.
The strengthening U.S. dollar has lately dented the price of gold, and rising interest rates are making some yield-bearing financial assets more attractive as a safe haven. But as Incrementum shows, there are many risks right now that favor owning gold in your portfolio.
Below I’ve selected five of the most compelling charts that highlight why I think you need gold in your portfolio now.
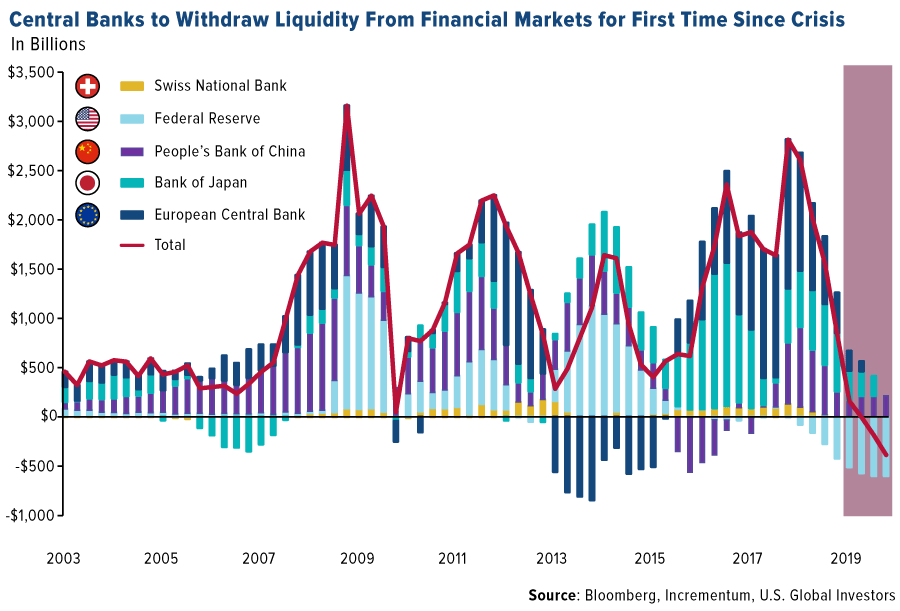
1. The End of Easy Money
To offset the effects of the global financial crisis a decade ago, central banks increased liquidity by slashing interest rates and buying trillions of dollars’ worth of government securities. Now, however, it looks as though banks are ready to start tightening, and no one is really quite sure what the consequences will be. The Federal Reserve was the first, in late 2015, to begin hiking rates, and it’s been steadily shrinking its balance sheet for about a year now. Other banks are set to follow suit. According to Incrementum, the tide will turn sometime next year, with global liquidity finally set to turn negative. In the past, recessions and bear markets were preceded by central bank tightening cycles, so it might be a good idea to consider adding gold and gold stocks, which have historically done well in times of economic and financial turmoil.
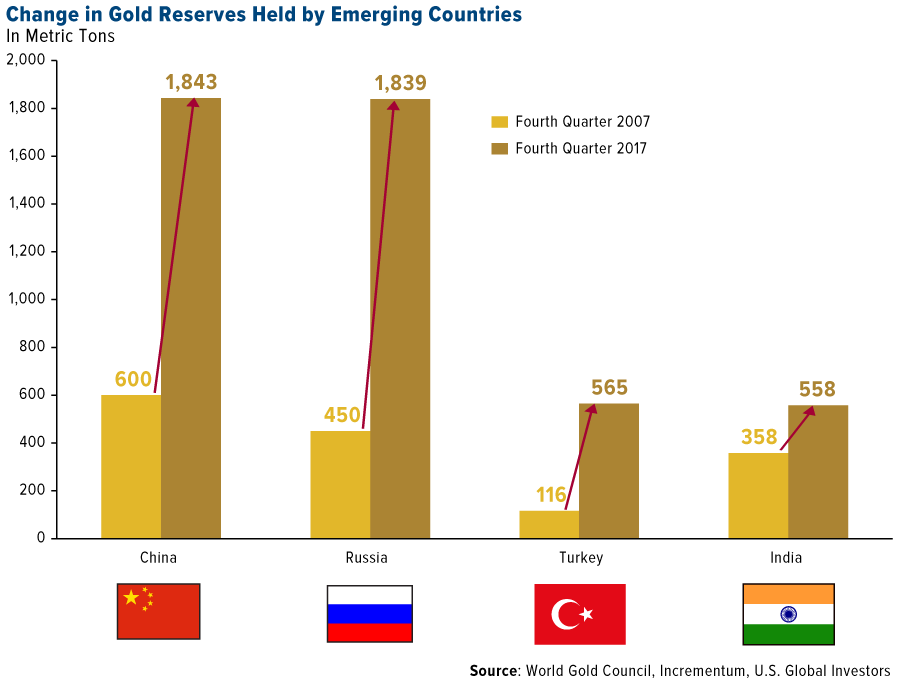
2. Banks on a Gold-Buying Spree
While I’m on this subject, central banks have been net purchasers of gold since 2010, with China, Russia, Turkey and India responsible for much of the activity. Just this week, I shared with you the news that Poland added as much as nine metric tons to its reserves this past summer. If gold is such a “barbarous relic,” why are they doing this? As Incrementum writes, “The increase in gold reserves should be seen as strong evidence of growing distrust in the dominance of the U.S. dollar and the global monetary system associated with it.” Having a 10 percent weighting in gold and gold stocks could likewise help you diversify away from fiat currencies and monetary policy.
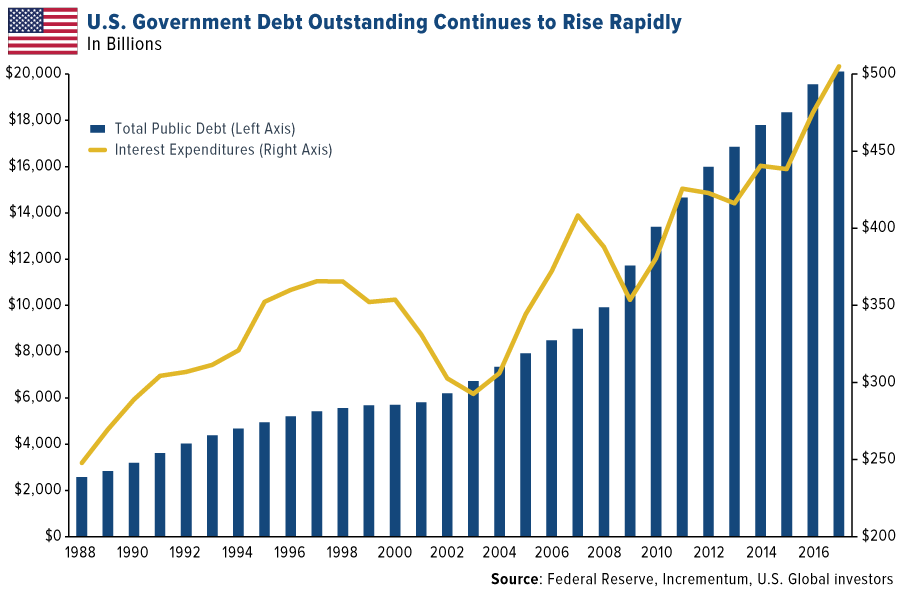
3. Too Much Debt
Everywhere you look, debt is rising to historic highs, whether it’s emerging market debt, student loan debt or U.S. government debt. Meanwhile, higher rates are making it more expensive to service all this debt. As you can see below, interest payments will hit a record $500 billion this year. It’s forecast that the federal deficit will not only reach but exceed $1 trillion in 2019. How will this end? Earlier this year, I called this risk the “global ticking debt bomb,” and I still believe it’s one of the most compelling reasons to maintain some exposure to gold.
4. An Exceptional Store of Value
In U.S. dollar-denominated terms, the price of gold is down right now. But in Turkey, Venezuela,Argentina and other countries whose currencies have weakened substantially in recent months, the precious metal is soaring. This alone should be reason enough to have part of your wealth stored in gold. Need further proof? According to a recent Bloomberg article, the cost of a black-market passport in Venezuela right now is around $2,000. That’s more than 125,000 bolivars, or 68 times the monthly minimum wage. A Venezuelan family that had the prudence to own gold would be in a much better position today to survive or escape President Nicolas Maduro’s corrupt regime. In extraordinary circumstances such as this, the yellow metal can literally help save your life.
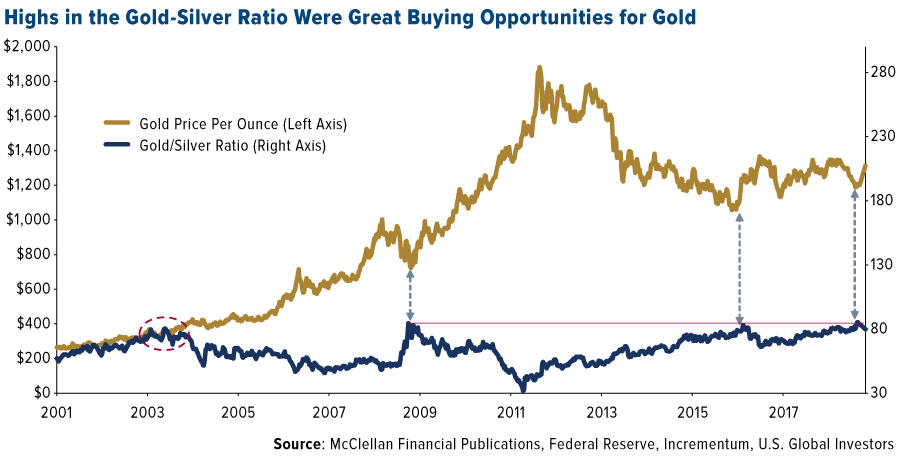
5. A Sterling Time to Buy Gold?
Finally, a word about timing. According to Incrementum, some of the best gold buying opportunities have been when the gold/silver ratio crossed above 80—that is, when it took 80 or more ounces of silver to buy one ounce of gold. If you look at the chart below, you’ll see that such instances occurred in 2003, 2009 and late 2015/early 2016—all ideal times to accumulate. We see a similar buying opportunity today, with the gold/silver ratio at a high of 83 as of October 8. What’s more, gold stocks are the cheapest they’ve been in more than 20 years relative to the S&P 500 Index.
Curious to learn more? Download my popular whitepaper on gold’s love trade by clicking here!
All opinions expressed and data provided are subject to change without notice. Some of these opinions may not be appropriate to every investor. By clicking the link(s) above, you will be directed to a third-party website(s). U.S. Global Investors does not endorse all information supplied by this/these website(s) and is not responsible for its/their content.
The S&P 500 Index is a widely recognized capitalization-weighted index of 500 common stock prices in U.S. companies.
Diversification does not protect an investor from market risks and does not assure a profit.
-
Share “5 Charts That Show Why Gold Belongs in Your Portfolio Now”

- We Could See $100 Oil Again Soon, But Not for the Reason You Think
- October 8, 2018
-

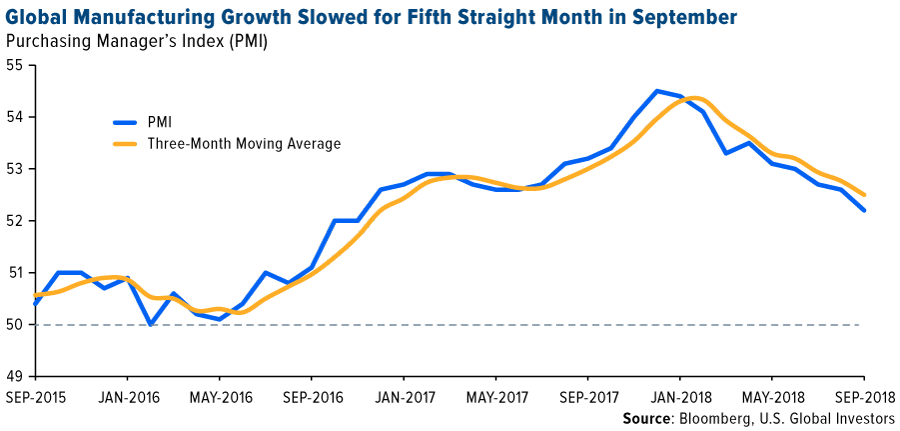
According to a recent Cornerstone Macro report, the three most influential macro trends this year have been 1) the strengthening U.S. dollar, 2) the flattening yield curve and 3) slowing global manufacturing expansion. I’ve written about all three topics numerous times this year, but the one I’ve watched the most closely has been global manufacturing, as measured by the purchasing manager’s index (PMI). Since its 12-month high of 54.5 in December 2017, the PMI has declined in eight of the past nine months. September marked the fifth straight month of slower manufacturing growth.
This matters because the PMI is a useful, forward-looking indicator of the economic health of the manufacturing sector, which accounted for around 15.6 percent of global gross domestic product (GDP) in 2016. Our research has shown that the index can be used to forecast world demand for materials and energy one, three and six months out, with a reasonable measure of accuracy.
Take a look below. The chart shows that, based on 10 years’ worth of data, copper and West Texas Intermediate (WTI) crude, as well as energy and materials equities, all benefited in the three months after the PMI crossed above its three-month moving average. WTI saw the biggest jump; 64 percent of the time, it gained 5 percent on average.
Conversely, in the three months after the PMI crossed below its three-month moving average, those same assets either fell or were effectively flat. Seventy-one percent of the time, copper lost a little over 1.5 percent on average when manufacturing growth began to slow.
Energy Up, Materials Down

So how accurate has the PMI been so far this year? The index crossed below its moving average in February, and since then, materials have predictably failed to gain traction. The S&P 500 Materials Index is down about 6 percent, while copper prices are off 13 percent on fears that demand in China, the world’s largest consumer of the metal, is shrinking. (Australian miner BHP Billiton reported last week, however, that it believes Chinese copper consumption is actually set to increase substantially, by as much as 1.6 million metric tons, between now and 2023, thanks to its ambitious Belt and Road Initiative (BRI)).
Crude oil and energy stocks, on the other hand, have fared very well on tightening supply in Venezuela and Iran, the latter of which is scheduled to face a new round of U.S. sanctions effective November 4. Since February, WTI prices have surged 13.6 percent and are now at four-year highs, while the S&P 500 Energy Index is up 2.7 percent. Oil traders are now betting that crude could rise to as high as $100 a barrel by next year, Reuters reports.
Does oil’s outperformance, despite a steadily cooling PMI, mean our research is flawed? Hardly. The index, remember, only tells us the probability that a price change will occur. Extraordinary government policies, such as the U.S. reimposing sanctions on Iran, must also be taken into consideration. If the PMI alone were 100 percent accurate 100 percent of the time, we would all be multibillionaires from betting on the winners every time. Sadly, that’s not the case.
Could We Reach “Peak Oil” Sooner Than Anticipated?
But back to $100-per-barrel oil. Not only are traders betting on a return to these prices, but banks are also baking it into their forecasts. In a note last week, HSBC said it sees “real risks of this happening” by 2020, adding that “there are clear signs of falling exports and builds in Iranian exports. We would expect to see much more tangible signs of falling exports ahead of the November cut-off.”
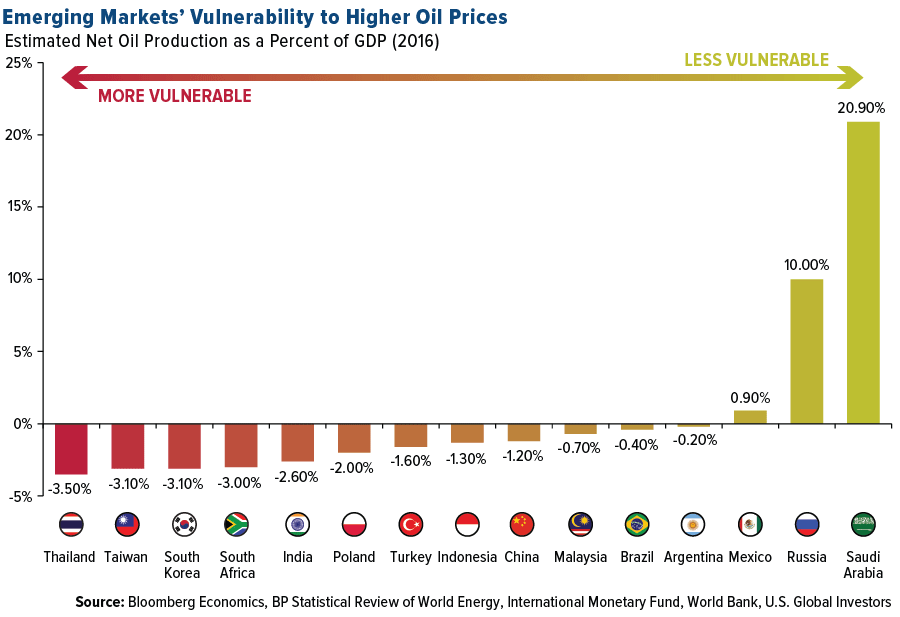
So how will this affect the global economy? It shouldn’t come as a surprise that net import countries would be most impacted by higher fuel costs. Among the emerging markets Bloomberg Economics estimates would feel the greatest pain are Thailand, South Korea, South Africa and India. Conversely, the economies that stand to benefit the most from rising oil prices are Mexico, Russia and Saudi Arabia.
Even higher prices could become a reality as soon as the next decade if world supply continues to tighten. Energy and mining research firm Wood Mackenzie (WoodMac) recently issued a warning that not enough oil discoveries are being made to replace capacity. “We need more Guyanas, a lot more, and we need them soon,” WoodMac chairman and chief analysts Simon Flowers urged, referring to the massive find made in the South American country early last year.
Spending on exploration collapsed following the price crash in 2014, which has propelled the world closer to “peak oil” much sooner than anticipated.
“The oil market could be running short of oil capacity by the late-2020s at the current low discovery rate,” Flowers said. “That’s worryingly near at hand given it takes the best part of 10 years for the average new discovery to build to peak production.”
The supply gap, according to WoodMac, could reach 3 million barrels per day (b/d) by 2030, 9 million b/d by 2035 and a “formidable” 15 million b/d by 2040.
A Promising New Copper Discovery
Speaking of new discoveries, I want to congratulate my friend Robert Friedland, founder and executive chairman of Ivanhoe Mines. The Canadian copper mining company announced last week the “important new discovery” of the metal on its 100 percent owned Western Foreland property in the Democratic Republic of Congo (DRC). Makoko, as it’s called, is Ivanhoe’s third major find in the DRC, following Kamoa-Kakula, which WoodMac has called the world’s largest, undeveloped, high-grade copper discovery.
After last Monday’s announcement, shares of Ivanhoe popped 9 percent on the Toronto Stock Exchange.
In the press release, Robert chalked the find up to “the accumulation of in-depth, proprietary geological insights gained by Ivanhoe’s exploration team during nearly two decades of exploring in the region.”
“Given the early drilling success at Makoko,” he added, “we are highly confident that we have the secret blueprint for additional exploration successes in the Western Foreland area in 2019 and beyond.”
Earlier this year, Robert visited our office and said that by 2021, “you’re going to need a telescope to see copper prices.” China’s BRI, as I mentioned earlier, is expected to boost demand dramatically as scores of new power plants and electrical grids come online. The Asian giant has also joined several other countries in requiring that electric vehicles (EVs) replace gas-powered ones over time. EVs need three to four times as much copper as traditional vehicles do.
With copper prices down close to 16 percent for the year, now might be an ideal buying opportunity.