Wolf Richter wolfstreet.com, www.amazon.com/author/wolfrichter
Ginormous numbers, FX swaps and spot trades, USD, EUR, JPY, GBP, Australian & Canadian dollars… but where the heck is China’s CNY?
It happens every three years: The Bank for International Settlements released its Triennial Central Bank Survey about the global foreign exchange (FX) and over-the-counter (OTC) derivatives markets, as it occurred in April. The numbers are ginormous, and get more ginormous with every survey, with trading volume measured in trillions of dollars per day
To start with, there are the amounts. Currencies are traded in pairs, such as the US dollar against the euro. In April 2019, trading in FX markets reached $6.59 trillion per day, up 30% from the prior survey period, April 2016. Trades with the USD on one side of the trade averaged $5.82 trillion per day in April 2019. This was up 31% from the daily average in April 2016 and was over five times the daily average in April 2001:
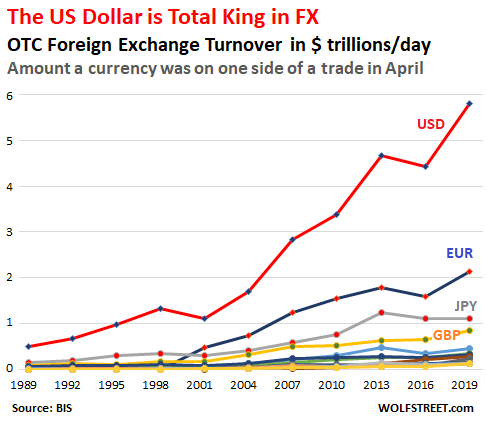
The sudden appearance of the euro in 2001 as the second largest currency out of nowhere indicates that at that time, it had just replaced five currencies, including the biggie, the Deutsche Mark.
The chart above shows the top 16 most traded currencies. Four have a significant share – USD, EUR, Japanese yen (JPY), and British Pound (GBP). The remaining 12 of the top 16 currencies are the limp spaghetti at the bottom of the chart, including the Chinese renminbi (CNY).
In terms of the share that a currency is on one side of a trade, the US dollar remains total King, at 88.3%. Its share has remained relatively stable over the years, despite three factors:
One, the arrival of the euro, whose share, after a brief surge to 38% between 2001 and 2010, got whacked by the euro debt crisis in 2010-2012, and fell to a series low of 31.4% in 2016. But in 2019, its share ticked up to 32.3%. This slight increase in share was due to higher than market-average growth in trading of the EUR/JPY and the EUR/CHF currency pairs.
Two, the surge of emerging market currencies, including the CNY, from near zero in 2001 to 21% in 2016, and to 24.5% in 2019.
Three, the arrival of the CNY, whose share rose from 0% in 2007 to 4.0% in 2016, but has essentially remained stuck there, at 4.3% in 2019, which puts the currency of the second largest economy in the world just below the currency of a tiny economy, Switzerland.
CNY trading, with a turnover of $284 billion a day, was in eighth place, with the USD being on the other side in 95% of the trades.
The Japanese yen, however, lost 5 percentage points in share since 2016, dropping to a new low of 16.8%, down from 28% in 1999. But it remains the third most actively traded currency. The report notes that the decline in turnover in 2019 was mostly a reflection in the decline of the JPY/USD cross “amid low volatility.”
Brexit or not, the British pound’s share has remained at 12.8%, approximately flat since 2010:
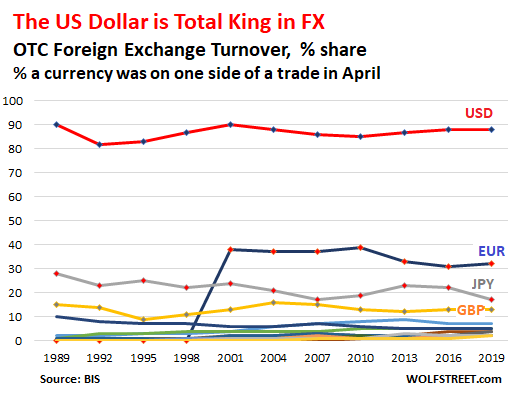
The chart below shows the percent share of the top currencies. Combined, the emerging market currencies weigh in with 24.5%, but individually, their share is small, with the CNY coming out at the top with a 4.3% share. The Mexican peso and the Turkish lira lost share:

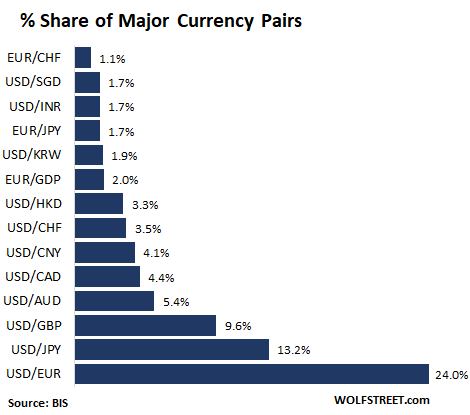
In terms of trading pairs, the USD/EUR was by far the most popular trade, with 24% share of the total FX turnover, followed by the USD/JPY:
Turnover grew in all categories:
The bulk of the growth in FX trading came from FX swaps, which jumped by 35% since 2016, to $3.2 trillion per day in April 2019, for a share of 48.6% of total FX market turnover. FX swaps are mostly used to manage funding liquidity and hedge currency risk. The USD was on one side of 91% of all FX swap transactions.
The turnover in spot trades also grew, but only by 20% over the three-year period, to $2.0 trillion per day, and its share fell to 30.2%.
Trading of outright forwards soared by 43% to $1 trillion per day, with a large part of the increase reflecting the surge of non-deliverable forwards (NDFs). This gave them a share of 15.2%.
Trading in FX options and other products rose to $294 billion a day, for a share of 4.5%
Trading in currency swaps ticked up to $108 billion a day for a share of 1.6%.
Where the heck does this data come from? The survey “involved central banks and other authorities in 53 jurisdictions,” which collect data from around 1,300 banks and dealers in their jurisdictions and reported it aggregated by country to the BIS. “Turnover data are reported by the sales desks of reporting dealers, regardless of where a trade is booked, and are reported on an unconsolidated basis, i.e. including trades between related entities that are part of the same group.” Yes, trillions of dollars per day.