“Price is what you pay, value is what you get.” – Warren Buffett
Just recently, I discussed the importance of valuations as it relates to investors who are close to retirement age. To wit:
“Unless you have contracted ‘vampirism,’ then you do NOT have 90, 100, or more, years to invest to gain ‘average historical returns.’ Given that most investors do not start seriously saving for retirement until the age of 35, or older, they have about 30-35 years to reach their goals. If that period happens to include a 12-15 year period in which returns are flat, as history tells us is probable, then the odds of achieving their goals are severely diminished.
What drives those 12-15 year periods of flat to little return? Valuations.”
Despite commentary to the contrary, the evidence is quite unarguable. As shown in the chart below, the cyclical nature of valuations and asset prices is clear.
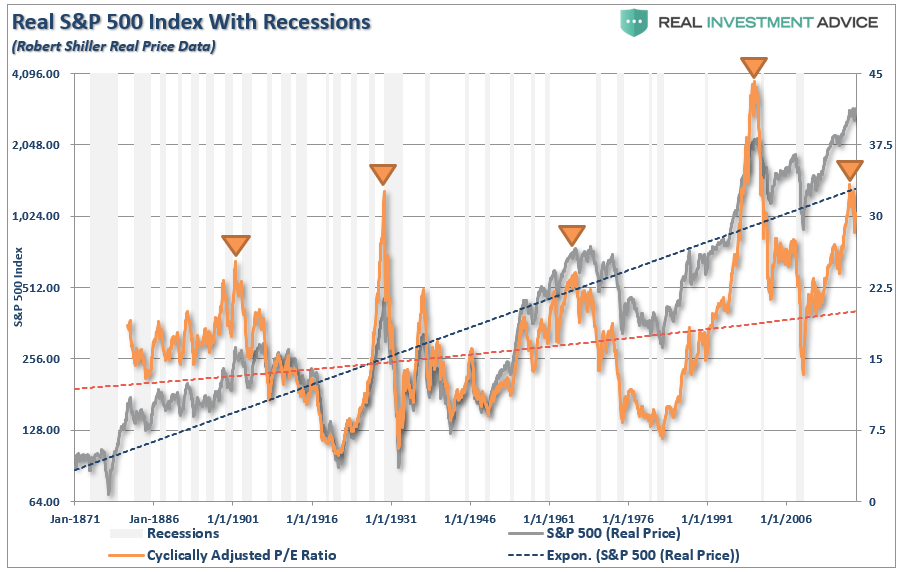
In the short-term, a period of one year or less, political, fundamental, and economic data has very little impact on the market. This is especially the case in a late-stage bull market advance, such as we are currently experiencing, where the momentum chase has exceeded the grasp of the risk being undertaken by unwitting investors.
What investors most often overlook, due to this “short-termism” or the “fear of missing out,” is the risk being undertaken which will lead to less optimistic outcomes over the investment time frame of 10 to 20-years.
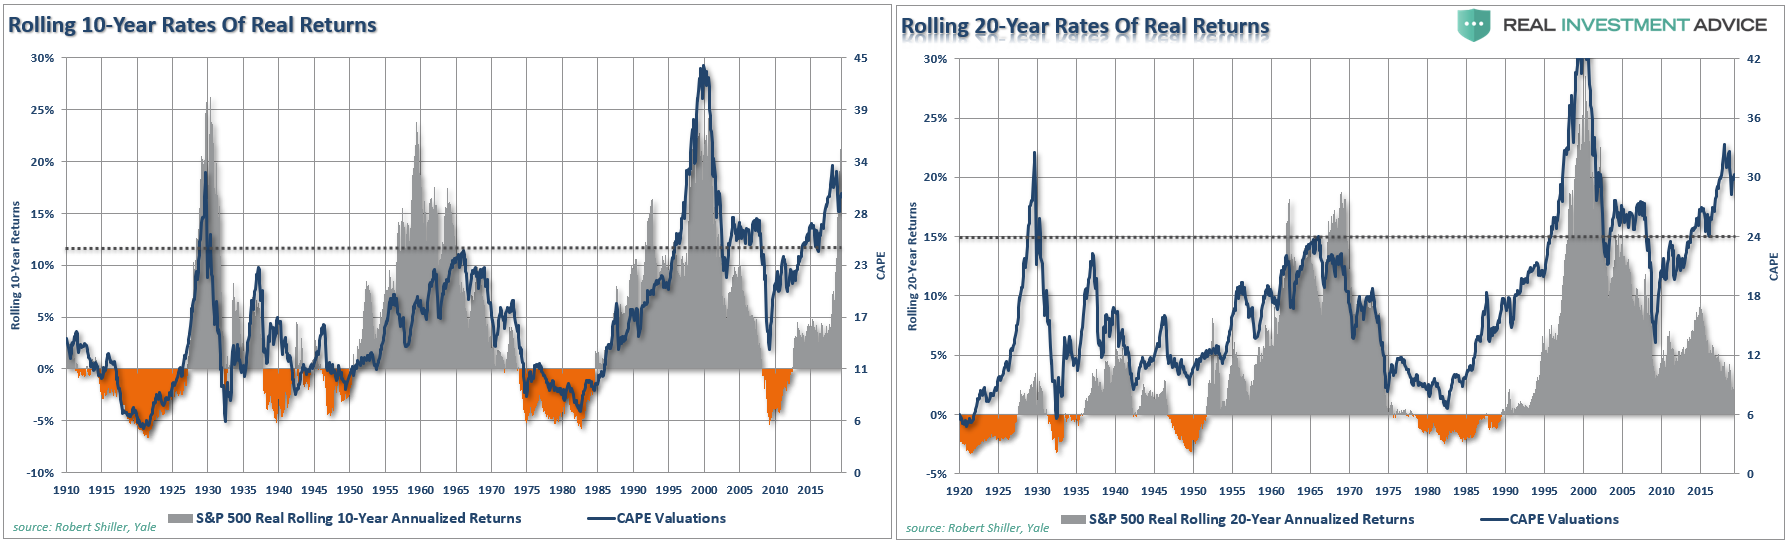
Just remember, a 20-year period of one-percent returns is indistinguishable from ZERO with respect to meeting savings goals. However, our focus today is looking at future returns over the next decade from current valuation levels which, again, are expected to be low to negative.
As I discussed previously in “You Carry An Umbrella In Case It Rains:”
“While daily, weekly, and monthly indications are useful, taking a look at ‘quarterly’ data can give us clues as to the ‘real risk’ investors are taking on at any given time. Is this the beginning of a major bull market cycle? Or, are we nearing the end of one? How you answer that question, given the relatively short time frame of the majority of investors (hint – you don’t have 100-years to reach your goals), can have an important impact on your outcome.
The problem for investors is that since fundamentals take an exceedingly long time to play out, as prices become detached ‘reality,’ it becomes believed that somehow ‘this time is different.’
Unfortunately, it never is.
The chart of the S&P 500 is derived from Dr. Robert Shiller’s inflation adjusted price data and is plotted on a QUARTERLY basis. From that quarterly data I have calculated:
- The 12-period (3-year) Relative Strength Index (RSI),
- Bollinger Bands (2 and 3 standard deviations of the 3-year average),
- CAPE Ratio, and;
- The percentage deviation above and below the 3-year moving average.
- The vertical RED lines denote points where all measures have aligned”
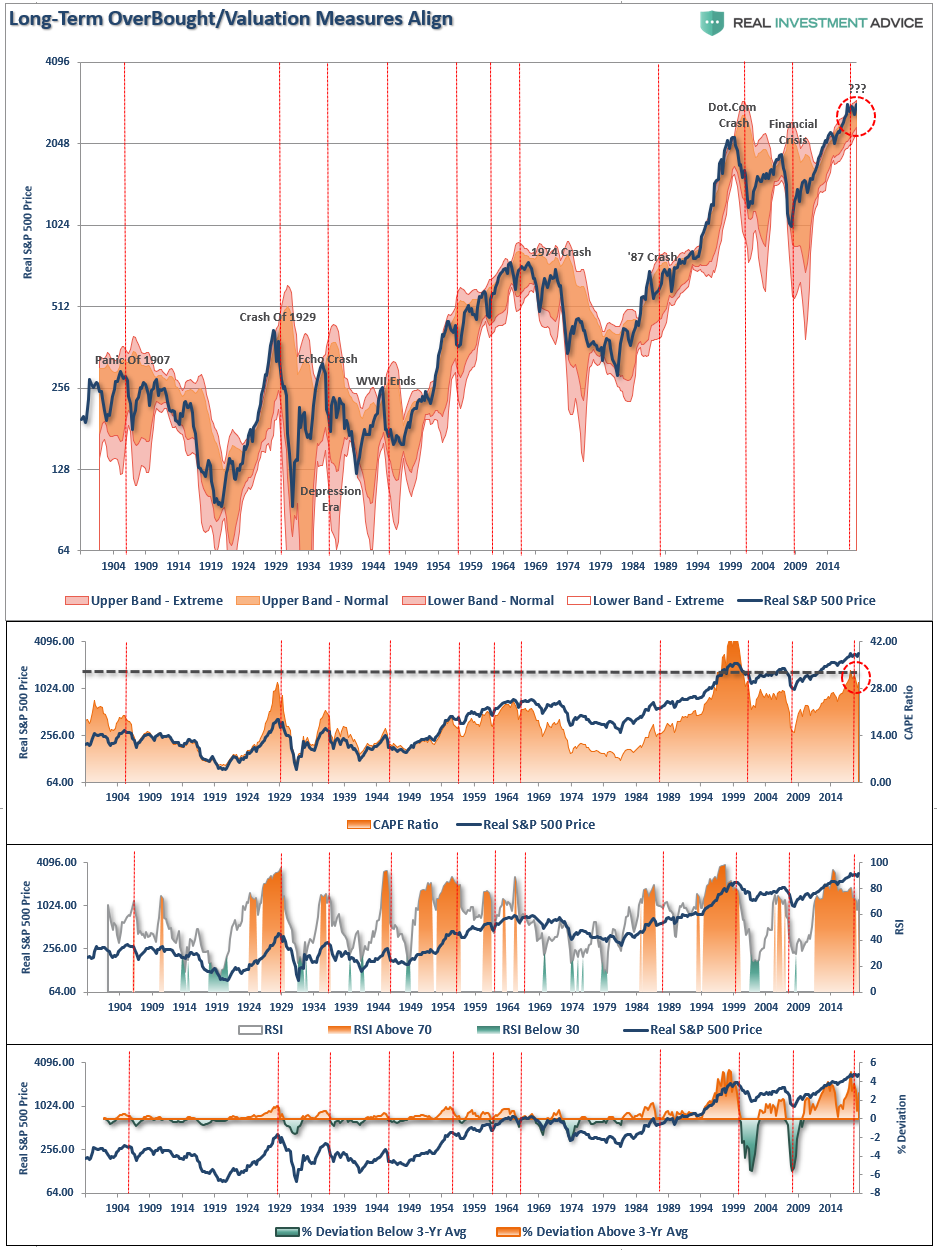
Even after the sideways action over the last 18-months, the extended technical measures remain. Importantly, this doesn’t mean the market will mean revert tomorrow, it does imply that forward returns for current levels will be substantially lower than they have been over the last several years.
Yes, I know.
“P/E’s don’t matter anymore because of Central Bank interventions, low interest rates, accounting gimmicks, share buybacks, etc.”
It was the same in 2000 and 2007 when the “bull market psychology” makes such antiquated ideas like “value”seem irrelevant.
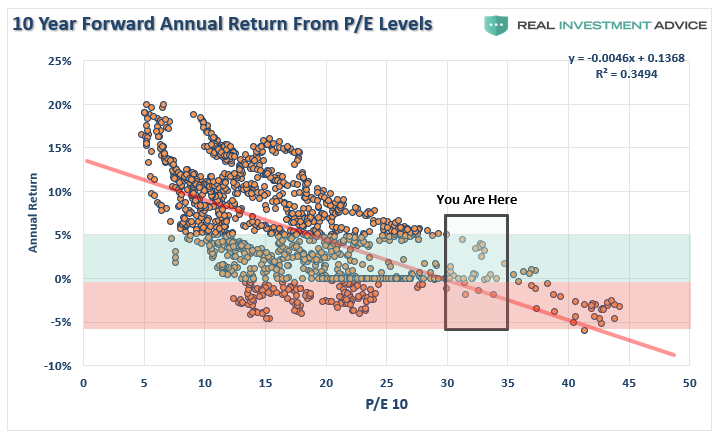
The important point to understand is that over the long-term investing period “value” and “returns” are both inextricably linked and diametrically opposed. As shown above, given current valuation levels, forward returns are expected to be lower than the long-term average.
Before we look at different valuation measures, let’s review what “low forward returns” does and does not mean.
- It does NOT mean the stock market will have annual rates of return of sub-3% each year over the next 10-years.
- It DOES mean the stock market will have stellar gains in some years, a big crash somewhere in between, or several smaller ones, and the average return over the decade will be low.
“This is shown in the table and chart below which compares a 7% annual return (as often promised) to a series of positive returns with a loss, or two, along the way. (Note: the annual average return without the crashes is 7% annually also.)”
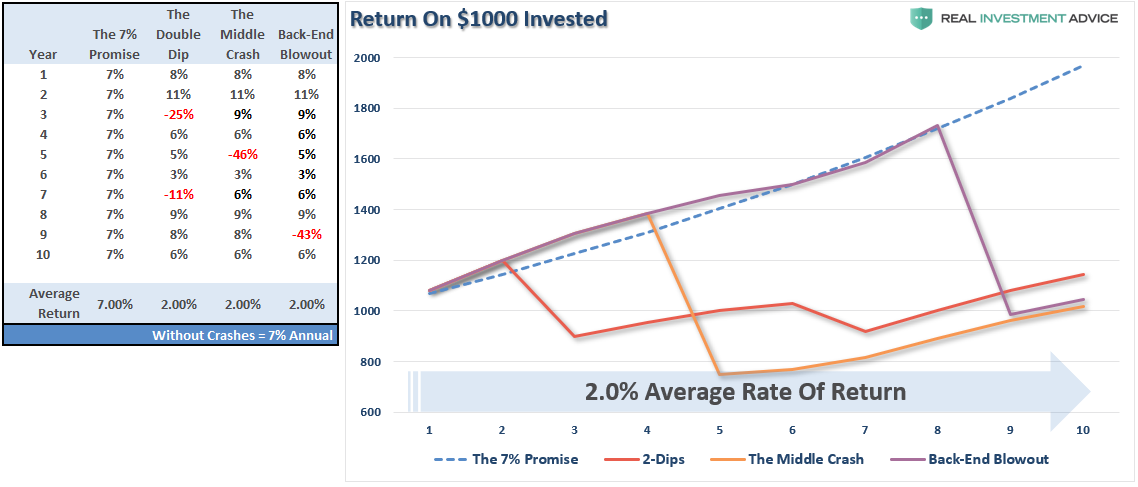
“From current valuation levels, two-percent forward rates of return are a real possibility. As shown, all it takes is a correction, or crash, along the way to make it a reality.”
This isn’t a prediction, it is just statistical probability and simple math.
With the premise in mind, let’s take a look at a variety of valuation measures as compared to forward 10-year returns.
The Charts
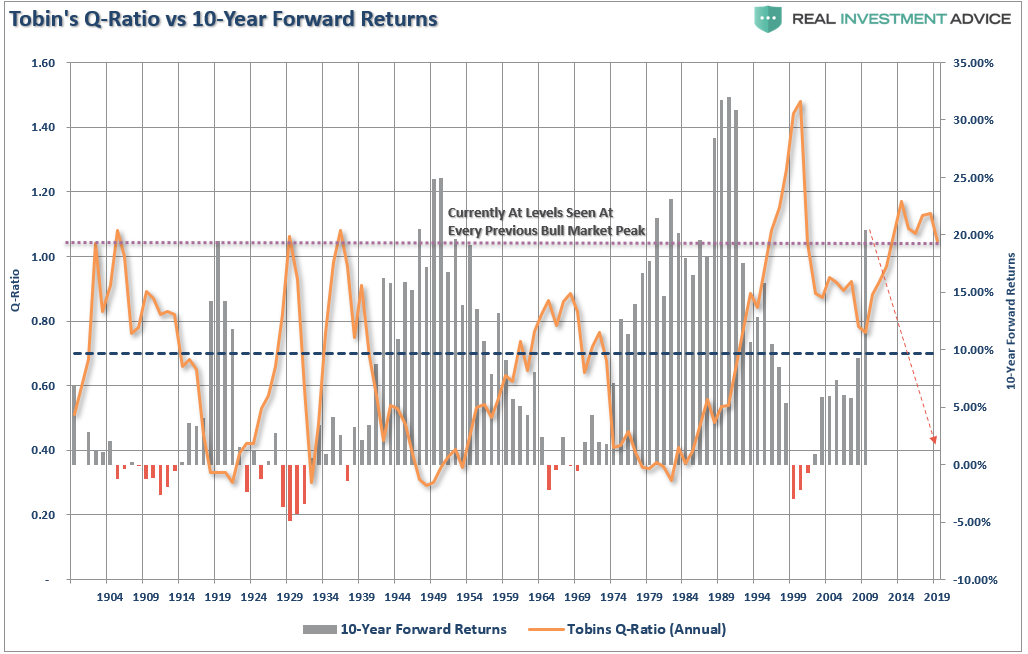
Tobin’s Q-ratio measures the market value of a company’s assets divided by its replacement costs. The higher the ratio, the higher the replacement costs resulting in lower returns going forward.
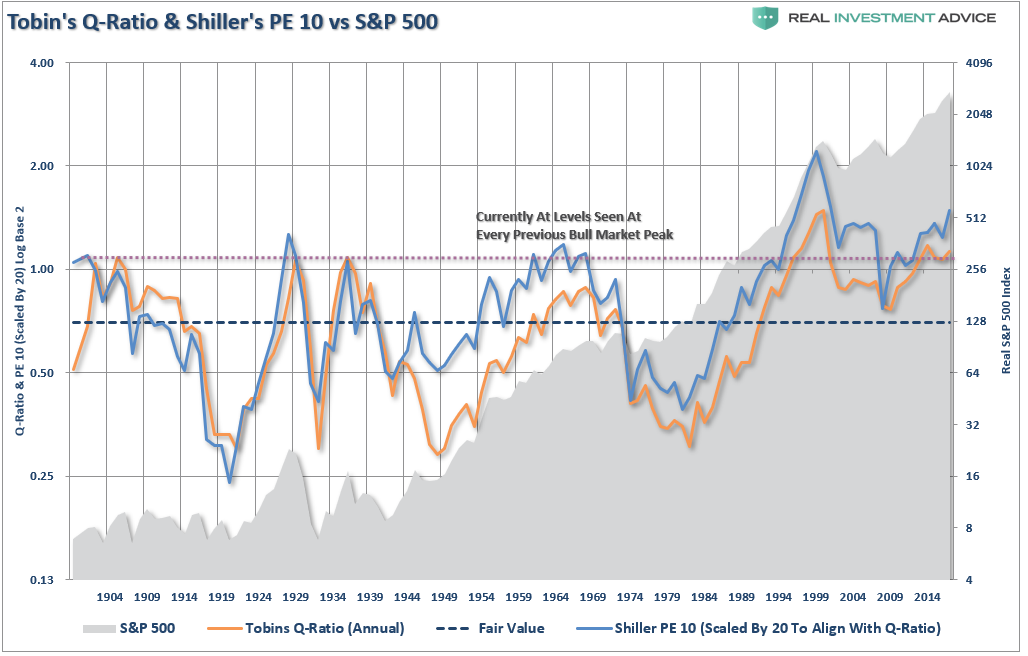
Just as a comparison, I have added Shiller’s CAPE-10. Not surprisingly, the two measures not only have an extremely high correlation, but the return outcome remains the same.
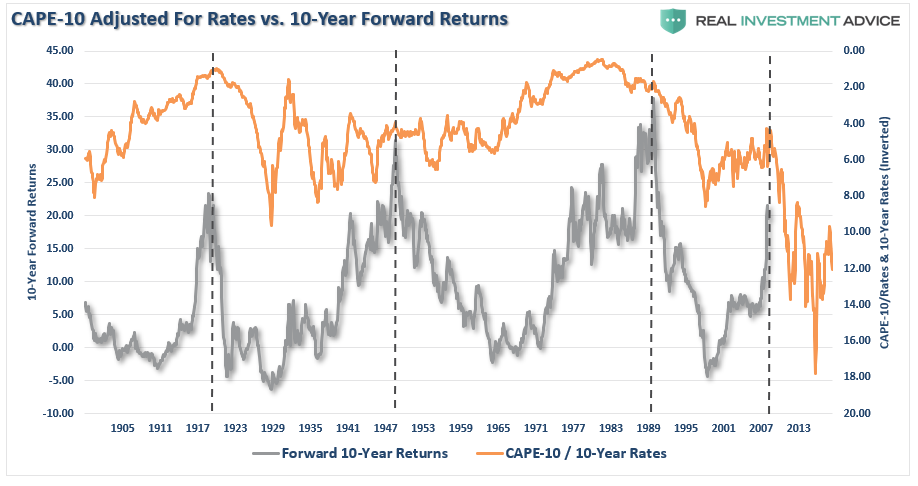
One of the arguments has been that higher valuations are acceptable because interest rates have been so low. As we can see below, when we take the smoothed P/E ratio (CAPE-10 above) and compare it to the 10-year average of interest rates (inverted scale) going back to 1900, the valuation to interest rate argument fails.
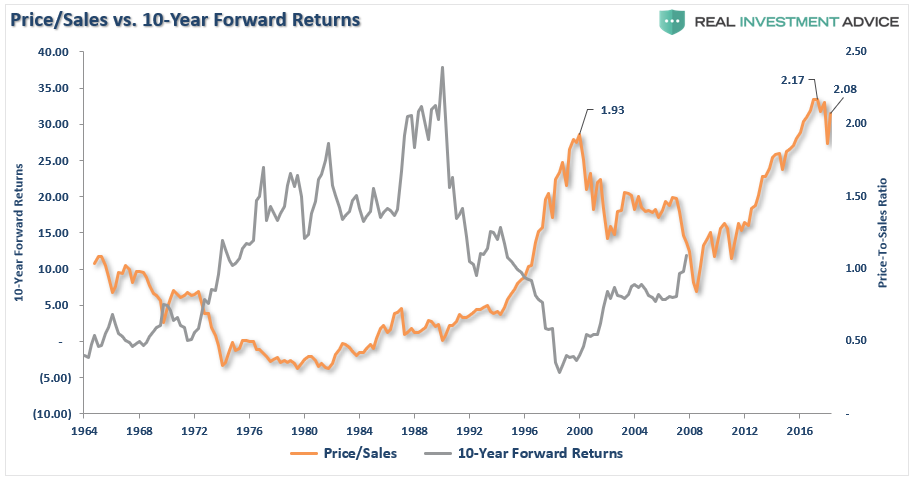
As noted above, historical valuation measures have been dismissed for a variety of reasons from Central Bank interventions to the rise of automation. However, while earnings can be manipulated through a variety of measures like share buybacks, accounting gimmickry, and wage suppression, “sales,” or “revenue,” which occurs at the top-line of the income statement is much harder to “fudge.” Not surprisingly, the higher the level of price-to-sales, the lower the forward returns have been. You may also want to notice the current price-to-sales is hovering near the highest level in history.
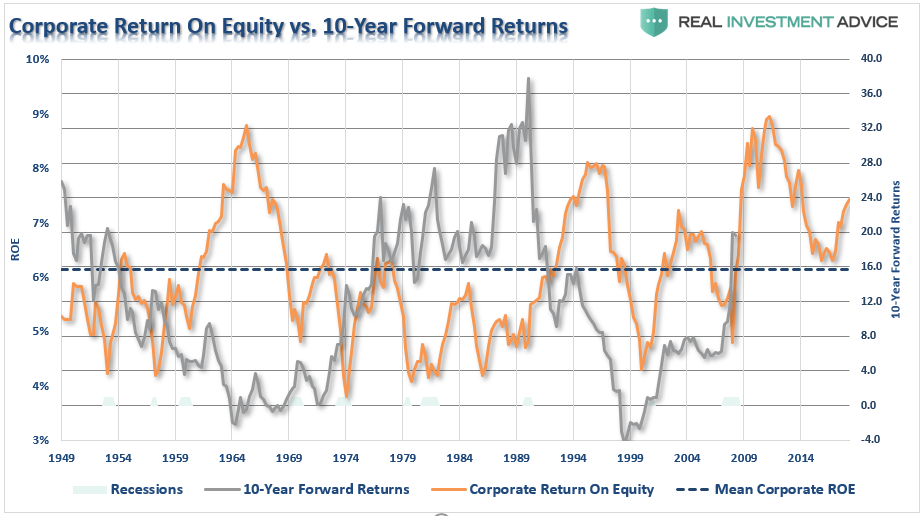
Corporate return on equity (ROE) sends the same message.
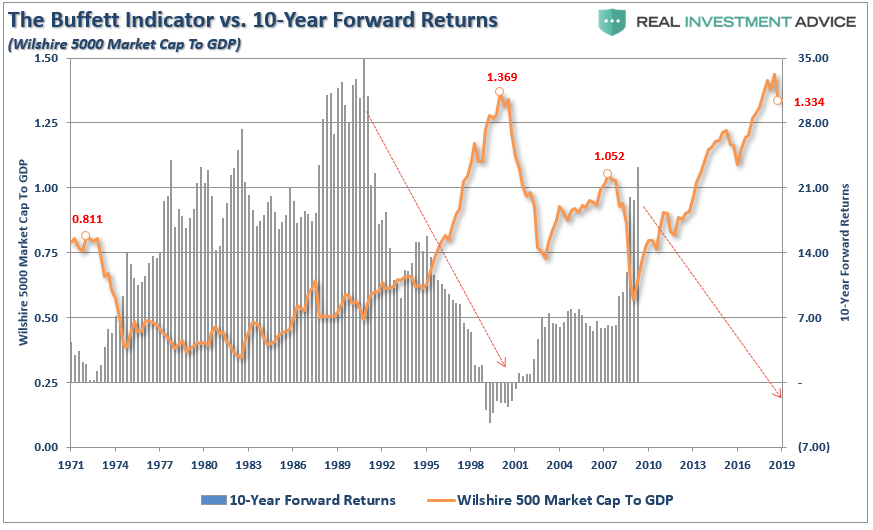
Even Warren Buffett’s favorite indicator, market cap to GDP, clearly suggests that investments made today will have a rather lackluster return over the next decade.
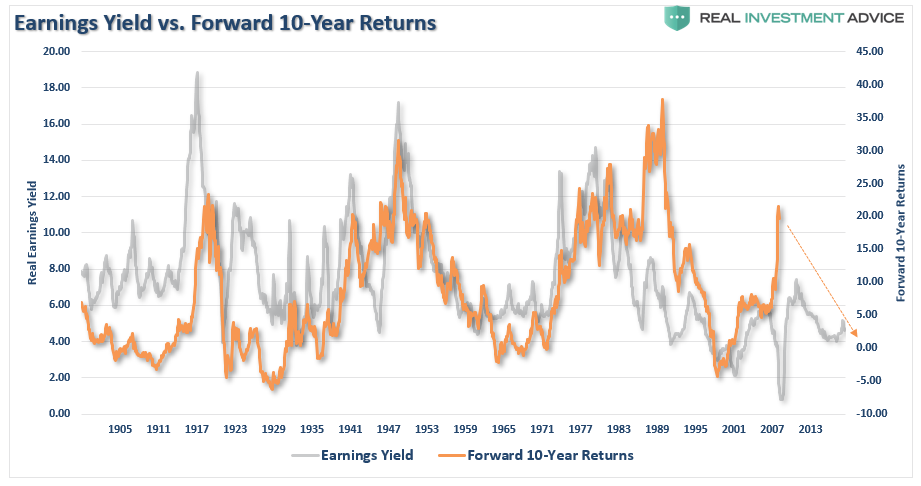
Even when we invert the P/E ratio, and look at earnings/price, or more commonly known as the “earnings yield,” the message remains the same.
We can reverse the analysis, as noted last week, and look at the “cause” of excess valuations which is investor“greed.”
“As investors chase assets, prices rise. Of course, as prices continue to rise, investors continue to crowd into assets finding reasons to justify overpaying for assets. However, there is a point where individuals have reached their investing limit which leaves little buying power left to support prices. Eventually, prices MUST mean revert to attract buyers again.”
The chart below shows household ownership of equities as a percent of household ownership of cash and bonds. (The scale is inverted and compared to the 5-year return of the S&P 500.)
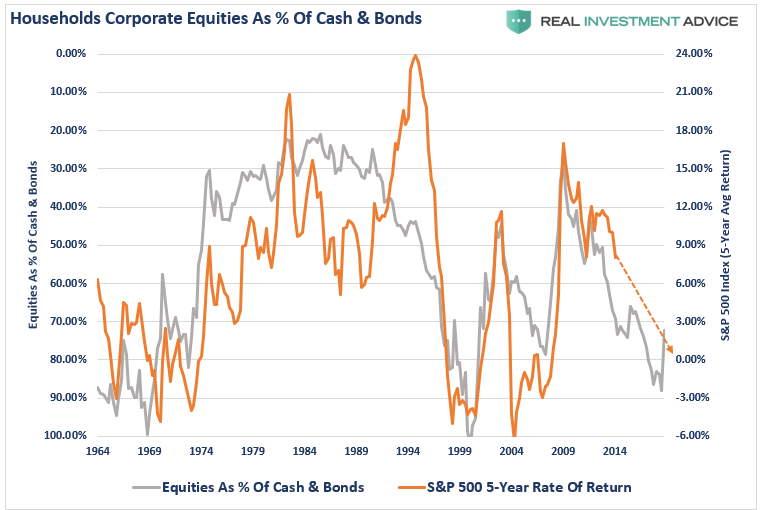
Just like valuation measures, ownership of equities is also at historically high levels and suggests that future returns for equities over the next 5, 10, and 20-years will approach ZERO.
No matter, how many valuation measures you wish to use, there is no measure which currently suggests valuations are “cheap” enough to provide investors with sufficiently high enough returns over the next decade to meet their investment goals.
Let me be clear, I am not suggesting the next “financial crisis” is just around the next corner. I am simply suggesting that based on a variety of measures, forward returns will be relatively low as compared to what has been witnessed over the last decade. Such results are historically NOT a factor of “just one” issue but rather a culmination of issues which are simultaneously ignited by a single, unforeseen, catalyst.
As Doug Kass noted on Monday, there is a growing list of issues which will coalesce given the right catalyst.
- Slowing economic growth
- Trade/Tariffs
- Credit spreads have begun to widen
- Geopolitical uncertainties (Russia, China, North Korea, Iran)
- Fiscal policy uncertainty
- Earnings growth at risk
- A very crowded momentum trade (ETF)
Most importantly, as stated above, none of these factors or measures mean the markets will just produce single-digit rates of return each year for the next decade. The reality is there will be some great years to be invested over that period, unfortunately, like in the past, the bulk of those years will be spent making up the losses from the coming recession and market correction.
That is the nature of investing in the markets. There will be fantastic bull market runs as we have witnessed over the last decade, but in order for you to experience the up, you will have to deal with the eventual down. It is just part of the full-market cycle which encompass every economic and business cycle.
How you choose to handle the second-half of the full-market cycle is entirely up to you. However, “this time is not different,” and in the end, many investors will once again be reminded of this simple fact.
Unfortunately, those reminders tend to come in the most brutal of manners.