Tomorrow, the US Department of Commerce will report its advance estimate of 2Q GDP which will be the long-awaited evidence that “Trumponomics” is working. The current estimates for the initial print run the gamut from 3.9% to over 5% annualized growth. Regardless of the actual number, the White House spokesman will be quick to take credit for success in turning America’s economy around.
But is that really the case? First, there are several things to remember about the initial print on economic growth.
- The initial estimate is based on the collection of estimates from Wall Street economists. With no real data in just yet, the initial estimate just a “guess.”
- The number is annualized. So, a growth of 1% in the economy is reported as 4%. However, as we know from the first quarter, quarterly growth can vary widely in a given year.
- Lastly, a one-quarter surge in economic growth doesn’t make much difference in the long-term trajectory of economic growth, or in this case, ongoing weakness. The chart below shows the change in economic growth by decade.

- In both the chart above, and below, I have penciled in a 4% increase in economic growth for the second quarter. Making similar adjustments for wages and productivity, we find the 5-year averages change very little. More importantly, current action is more typical of a late cycle expansion as opposed to the beginning of a new one.

Secondly, while the print will undoubtedly be a strong one, and not unexpected following a weak Q1 growth rate, the question is whether it is sustainable? A recent note from Goldman Sachs suggests some caution:
“An unusually large number of one-off factors appear to have boosted 2Q GDP, many of which are directly related to escalating trade concerns. As companies and countries race to secure supplies that may become expensive later on, exports have surged and inventories have swelled. If these trends are one-time adjustments (and our economists believe they are), the ‘payback’ in 2H could be significant. Enjoy the 2Q GDP number, which may be the last best print for a while.”
This is likely correct. As 2018 has seen a steady increase in trade tensions, and trade actions, between the US and its trading partners, we have already begun to see some of the negative impacts from those actions. Just this past week Boeing ($BA), General Motors ($GM) and Whirlpool ($WHR) all had disappointing reports with comments directly related to the negative impact of tariffs on their results. They are surely not going to be the last as the US has slapped tariffs on washing machines and solar panels in January, on steel and aluminum in March, and on US$34 billion of goods from China on July 6. Now, the administration is talking about another 25% tariff on close to $200 billion in foreign-made automobiles later this year.
Morgan Stanley also made very similar comments in their recent analysis about the unusually large number of one-off factors which appear to have boosted 2Q GDP, most of which are directly related to escalating trade concerns.
“As companies and countries race to secure supplies that may become expensive later on, exports have surged and inventories have swelled. If these trends are one-time adjustments (and our economists believe they are), the ‘payback’ in 2H could be significant. Enjoy the 2Q GDP number, which may be the last best print for a while.
The ‘stockpiling’ in exports could be responsible for 1.5 percentage points of our 4.7% 2Q GDP estimate. ‘Stockpiling’ also appears to be at work for US companies, albeit to a more limited extent. The inventory build in 2Q is tracking at +US$38 billion, versus a +US$10 billion rate in the prior two quarters. And what’s more interesting is the areas where those inventories are building, which have material overlaps with trade: electrical goods, machinery equipment, motor vehicles and parts.”
In other words, the contribution to Q2 GDP from inventories alone would be roughly 2.2%, or roughly 50%, of the total increase. Such would be the single biggest combined contribution since 4Q11 when the U.S. was restocking auto inventories following the tsunami-related shutdown of Japan.
These one-off adjustments are unsustainable and simply represent the pull-forward of demand that will be given back over the subsequent quarters. Following the economic reboot in Q4 of 2011, as Japan’s manufacturing came back online, the next five quarters averaged just 1.6%.
Another reason, the second quarter economic growth print may be a “one-time” bonanza, is that tariffs are not only impacting U.S. companies and their profitability, it is also filtering through the rest of the economy as recently noted by ECRI:
“As the chart shows, real personal income and consumer spending growth are both in cyclical downturns.”
“Contrary to the notion of a ‘strengthening’ economy, consumer spending growth has fallen to a 4 ¼-year low, as personal income growth continues to undershoot spending growth.
The consumer — which makes up about 70% of the economy — is getting hit with a six-year highs in inflation, so real wages are actually lower than a year ago.
The chart also shows that the income shortfall relative to spending is increasing, and since 2015 the cumulative shortfall is over 1% of GDP. Necessarily, that gap is financed by consumers taking on more debt.
Away from the trade war rhetoric, which hasn’t really made a big impact yet, the lack of real income gains is why many are having a harder time making ends meet.
The expected strength in Q2 GDP growth comes in large part from energy production and a temporary fiscal boost, which are both non-cyclical events. Of course, higher gas prices also hurt the consumer.”
With wage growth stagnant, corporations struggling to pass through rising commodity and tariff related costs and debt service requirements on the rise as the Fed continues to hike rates, the drag from the consumption side of the economic equation will likely dwarf the current boosts in the next two quarters.
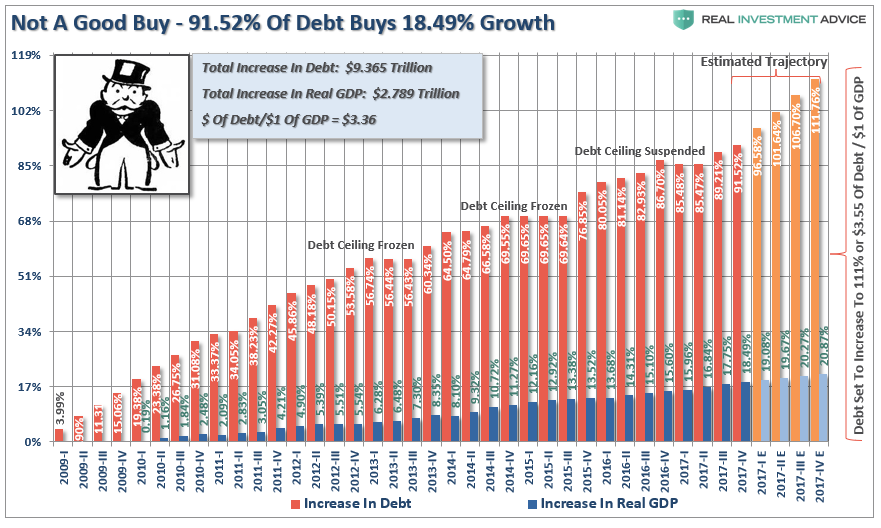
Furthermore, as I noted previously, tax cuts and reform, tariffs and other fiscal remedies promoted by the current administration fail to address the main drag to economic growth over time. The debt.
“It now requires $3.71 of debt to create $1 of economic growth which will only worsen as the debt continues to expand at the expense of stronger rates of growth.”
In fact, as recently noted by our friends at the Committee for a Responsible Federal Budget, the U.S. deficit is set to surge. To wit:
“The White House Office of Management and Budget recently released its annual mid-session review which updated deficit projections in its fiscal year 2019 budget request. The report projected deficits will reach $1.085 trillion in FY 2019 under their budget, which is double the $526 billion called for in the FY 2018 budget.”
The report specifically addresses the biggest point of concern:
“The last time the nation experienced trillion-dollar deficits was during a serious economic downturn, no less – lawmakers took the issue seriouly. PAYGO laws were established, a fiscal commission was formed, new discretionary spending caps were implemented and policymakers entered a multi-year debate on how best to bring down long-term debt levels.
This time around, with the emergence of trillion-dollar deficits during a period of economic strength – when we should be saving for future downturns – few seem to even take notice. On our current course, debt will overtake the size of the entire economy in about a decade, and interest will be the largest government program in three decades or less. This will weaken both our economy and our role in the world.”
Of course, the debt commission failed, what few spending cuts that were put in place have been fully repealed and unsurprisingly surging debt levels continue to surge as economic growth remains weak.
Furthermore, while many in the current administration like to use the Congressional Budget Office (CBO) projections as they are always overly optimistic, it is important to note the CBO gives no weight to the structural changes which continue to plague economic assumptions. The combination of tariffs and tax cuts combined with the major headwinds to economic growth are daunting.
- Spending hikes
- Demographics
- Surging health care costs
- Structural employment shifts
- Technological innovations
- Globalization
- Financialization
- Global debt
These factors will continue to send the debt to GDP ratios to record levels. The debt, combined with these numerous challenges, will continue to weigh on economic growth, wages and standards of living into the foreseeable future.
So, while the economic report on Friday will be a “rosy” picture in the short-term, it is likely going to be the best print we see between now and the onset of the next recession.
Lance Roberts

Lance Roberts is a Chief Portfolio Strategist/Economist for Clarity Financial. He is also the host of “The Lance Roberts Show” and Chief Editor of the “Real Investment Advice” website and author of “Real Investment Daily” blog and “Real Investment Report“. Follow Lance on Facebook, Twitter and Linked-In