by C Hamilton
- The annual growth of the working-age population is the organic baseline for growth in national, regional, and global consumption.
- However, since World War II, interest rate policy has moved inversely of annual working-age population growth, to incent ever more debt as working-age population growth has decelerated to nothing.
- Interestingly, total annual change in energy consumption has mirrored annual working-age population growth.except where synthetic growth has been temporarily substituted to maintain the appearance of growth (aka, China).
- Eventually, the inorganically rising consumption and asset prices will return to their organic baseline.and that will be a very rude new dawn for those who believed in infinite growth.
- New debt is primarily undertaken in the 1st world nations where income and savings are higher but also credit is readily available and standards for this credit vary widely, by asset type (zero for student loans, low for vehicles, moderate to high for homes…since ’07).
- It is primarily the working-age population that undertakes new debt while those in the post working age population tend to deleverage and pay down existing loans (this has the opposite monetary effect of destroying money).
- From 1950 to 2008, it was the significantly larger developed world growth of the working-age population over that of the post working-age population that supported new debt, money creation, and rising asset prices…the current and future reversal of these proportions is the likely rationale for federal governments and central banks to engage in ZIRP, NIRP, QE, and other activist / experimental policies to offset the demographic driven collapse in the money supply.
- The lending amid the declining working age population among the developed world and the decelerating growth among Asia cannot be made up by accelerating demographic growth in Africa. Global inequality and lack of broadly shared wealth means Africa hasn’t the income, savings, and/or access to credit to provide significant global demand.
So, it’s the growth of the working-age population in the developed world that is critical for the growth of money within a fractional reserve system. And that working-age growth need be significantly greater than the growth of the credit averse post working-age population. Growth among the working-age population in Asia (excluding East Asia + Singapore) and/or Africa has relatively little impact as the vast majority there have relatively little income, savings, and/or access to credit.
I divide the world into three mega-regions: developed world, Asia, Africa.
They consist of the following and as of 2020, with following proportions…
Developed World = Western Hemisphere, Oceania, West/East Europe Including Russia), East Asia (China, Japan, Taiwan, S/N Korea)
- 47% of global working age population but -4% of annual growth in global working age population
- By 2030, developed world will represent -31% of annual growth in global working-age population
- By 2040, developed world will represent -19% of annual growth in global working-age population
- 1st world is 74% of global energy consumption
Asia = (South Asia, Middle East, Central Asia)
- 39% of global working-age population but 61% of annual growth in global working-age population
- By 2030, Asia will represent 59% of annual growth in global working-age population
- By 2040, Asia will represent 34% of annual growth in global working-age population
- Asia is 22.5% of global energy consumption
Africa
- 14% of global working-age population but 42% of annual growth in global working age population
- By 2030, Africa will represent 72% of annual growth in global working-age population
- By 2040, Africa will represent 85% of annual growth in global working-age population
- Africa is 3.5% of global energy consumption
Global Working-Age Demography:
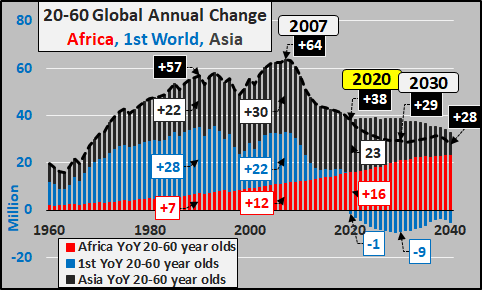
The chart below shows total annual growth (in millions) among the 20 to 60-year-old global population. Global annual growth of working age adults peaked in 2007. Since then, annual working age population growth has been decelerating, and by 2030 will be less than half the peak annual growth. What growth remains has shifted to the poorest and turned to outright declines among the relatively wealthier nations.
- Annual working-age growth in the 1st world has ceased as of 2020, and now outright progressively larger declines will be a secular feature indefinitely.
- Annual growth among Asia is decelerating and will continue to decelerate indefinitely.
- Annual growth in Africa is accelerating and will do so through mid-century.
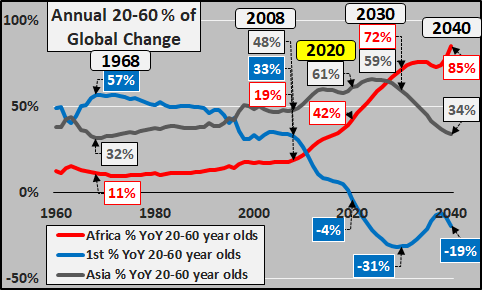
The second chart breaks out the geographical location of the annual 20 to 60 year-old total population growth. This is so critical, because again, it is the far higher incomes, savings, and access to credit among the 1st world working-age population that drives consumption, debt, and resultant money creation (via fractional reserve banking).
Note that the majority of working age population growth was in the 1st world through 1995 and 1st world growth remained a strong feature until 2008. From 2008, the inevitable decline of the 1st world working age population (given the previous decades of declining births and fertility rates…see charts at article end), has meant a collapsing portion of working age growth in the 1st world. And as the chart below details, this 1st world decline is about to get far more severe. Note the portion of growth in Asia will soon peak and begin decelerating rapidly. This leaves a ramping portion of the working age population growth in Africa. This is so important as the population growth of the working age in Africa among those with the lowest global incomes (less than 1/10th those of the first world), minimal savings, and little to no access to credit. This African working age population growth is like multiplying a large number against a tiny fraction. There is little monetary capability for consumption or credit driven demand.
Impact of Working-Age Demography on Energy Consumption:
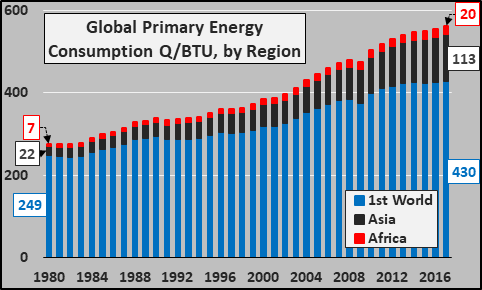
Next, I use total energy consumption as the best proxy for real economic capacity and demand. The chart below again splits the world energy consumption among the 1st world, Asia, and Africa (primary energy consumption equals all oil, natural gas, coal, nuclear, and renewable energy consumed in each region). What should be abundantly clear is the 1st world is consuming energy far beyond their share as a population, Asia rising but still far below that of the 1st. Also noteworthy is the sustained minimal energy consumption of Africa.
Next, looking at energy consumption as a percentage of total consumption by region. Note the percentage growth of consumption in Asia, inverse deceleration of the 1st world energy consumption, and the near non-existence of Africa as a global energy consumer. Africa has consistently consumed only 2% to 4% and shows no signs of imminent increase.
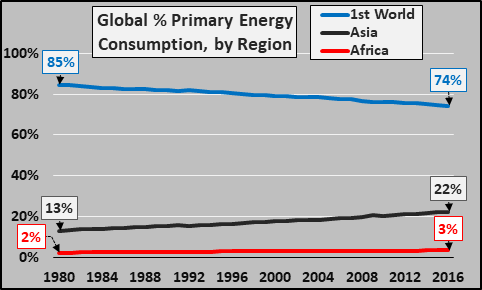
So, it is clear the 1st world plus Asia do nearly all the consuming (96.5% of the global consuming…true for energy, true for exports, etc.) and these trends show no imminent signs of change and actually it appears with the deceleration taking place in the 1st world, Africa is decelerating with them (details at end of article).
Elderly Global Demographics:
But what of the deleveraging elderly?
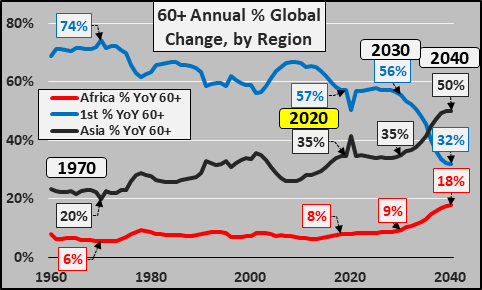
The next chart focuses on the break-down of the annual 60+ year-old global population growth. As of 2020, the share of elderly (60+ year-olds) around the world is highly skewed to the 1st-world with the following proportions:
- 1st-world; 65% of 60+ year-olds, 57% of annual growth in elderly
- Asia; 28% of 60+ year-olds, 35% of annual growth
- Africa; 7% of 60+ year-olds, 8% of annual growth
60+ year-old annual growth will peak in 2030 and begin decelerating thereafter with annual growth shifting away from first world to Asia and Africa.
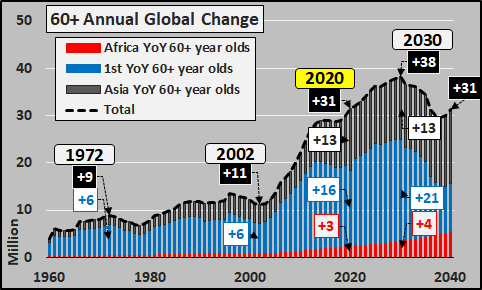
Below, the breakdown by region of the still surging growth in 60+ year-olds. At present, the growth is trending toward Asia and away from the 1st world…however, sometime after 2030, the portion of growth in Africa is projected to begin rising and 1st world growth decelerate significantly.
So, by 2030…
- Global working age population growth will slow by 45%
- Global working age population growth will shift almost entirely to Africa, decelerate in Asia, and continue declining in the 1st world
- Global growth in elderly will continue surging, particularly in the 1st world and Asia The impacts on credit/debt utilization and consumption among the declining 1st world working age population should be severely negative with little to no chance for the growth in Africa to overcome the collapsing 1st world demand. With this situation, a negative feedback loop is established for real assets such as homes, commercial real estate, consumer goods (cars, phones, appliances, etc.) and the factories and supply chains that support these. A global decline in real consumption is highly likely as these demographic trends play out and secular economic depression will be the primary feature for decades.
This is the siren song to the central banks to artificially create inflation through monetization rather than rising demand. The current rising asset prices via monetization and interest rate policy misuse is only worsening the eventual workout and rebalancing of the system.
Breaking down the Regions:
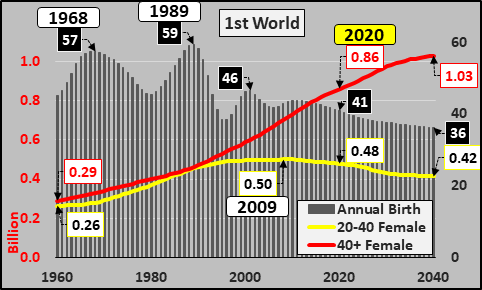
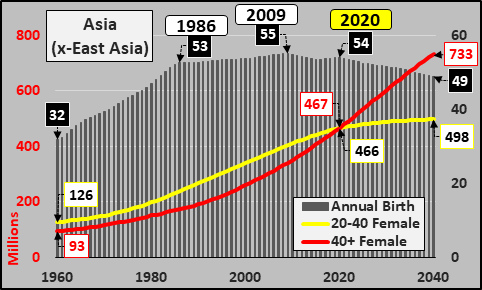
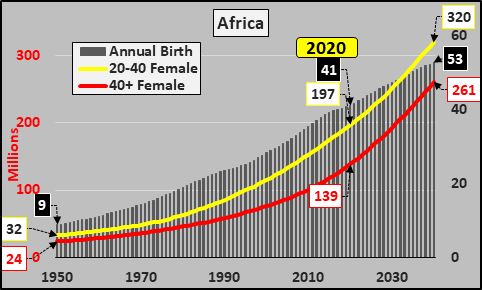
The chart below shows annual births (black columns), the 20 to 40 year-old childbearing female population (yellow line), and post childbearing female population (red line).
The 1st world childbearing female population peaked in 2009 and has been declining ever since. The declining number of 1st world females (inclusive of immigrants) coupled with declining and far below replacement fertility rates, means 1st world births continue the 5+ decade trend of declining. However, with the faster decline in childbearing females, there appears to be a quickening to the downside of births underway, falling millions below the UN’s projected 2018 / 2019 medium variant below.
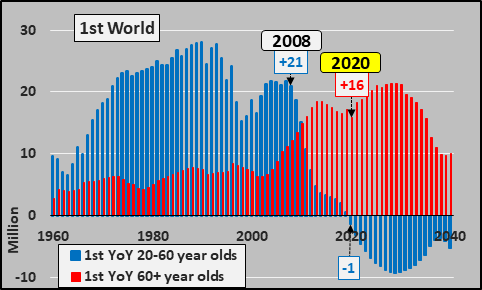
2020 is the first year of outright 20 to 60 year-old working age declines in the 1st world (blue columns) and a slight trough in the surging 60+ year-old elderly growth. Also, hard to miss the demographic cliff’s edge that was 2008 and the free-fall in annual growth since.
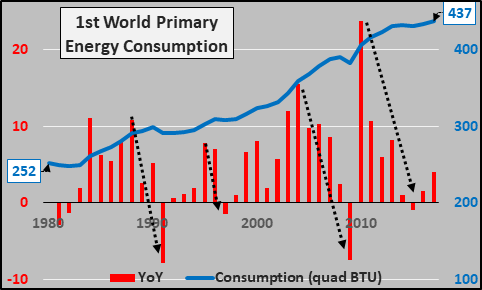
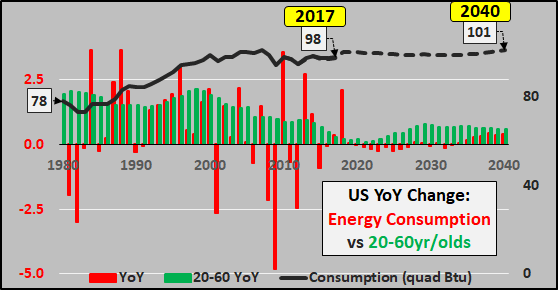
Through 2017, the 1st world consumes 437 quadrillion BTU’s or 75% of global energy (blue line) but the clear association of year over year changes (red columns) with economic accelerations/decelerations is plain to see. The energy consumption data is unequivocally pointing to the fact we were/are in a period of slowing growth or outright decline.
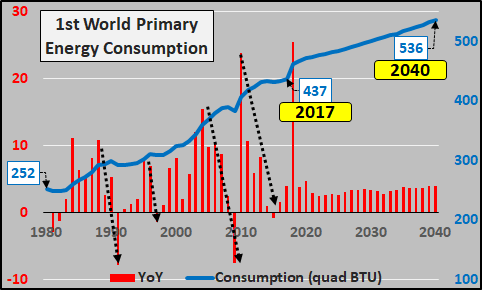
Below, including the 2018 through 2040 EIA energy growth consumption projections. While the 1st world working-age population & childbearing females decline, and births plummet (not to mention ongoing adoption of energy conservation and energy saving technologies), 1st world energy consumption is anticipated to continue rising at nearly 2/3rds the average pace it has since 1980. The 1st world is projected to account for about 44% of the global growth in energy consumption through 2040.
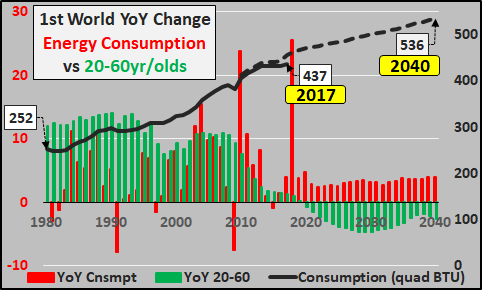
And adding total 1st-world energy consumption plus year over year changes in energy consumption vs. year over year changes in 20 to 60 year-olds 1st world residents. Again, the declining population versus projected energy consumption growth makes no sense. *The EIA current and projected data has discrepancies, better to focus on the annual projected energy consumption changes.
The accelerating pace of annual births in Asia ended in 1986. While Asian births peaked in 2009, they have essentially been unchanged for nearly three and half decades. Likewise, the growth of the Asian childbearing females (yellow line) has been decelerating and as of 2020, the population of post-childbearing females has exceeded the childbearing females. Both trends will quicken over the upcoming decades. With a flattening female childbearing population coupled with soon to be negative fertility rates in Asia, a larger deceleration in annual births than projected below is the likely outcome.
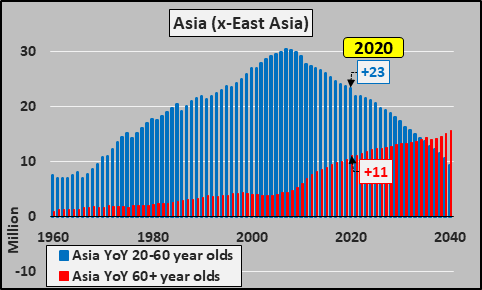
The decelerating annual growth of the working-age Asian population (blue columns, below) versus the accelerating post working-age Asians (red columns) is hard to miss.
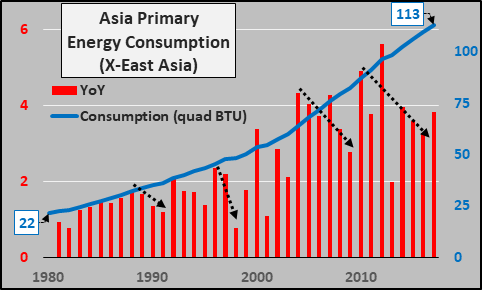
Asia (excluding East Asia) consumes 21.6% of global energy as of 2018. Interestingly, the declines in Asian energy consumption during 1st world economic downturns are not as deep as seen in East Asia and/or Africa.
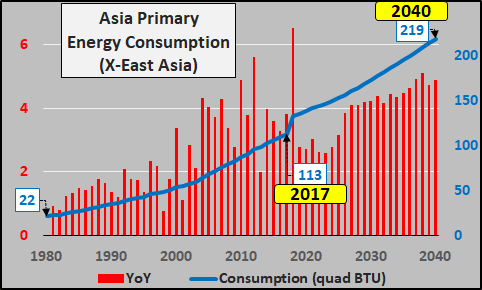
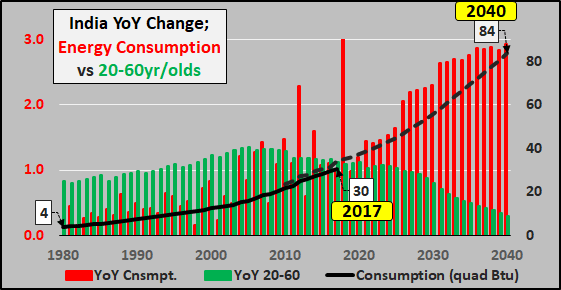
Below, 2018 through 2040 EIA energy consumption projections. While Asian annual working-age population growth continues decelerating and annual Asian births declining, energy consumption is projected to continue accelerating in Asia to nearly double the average pace energy consumption rose from 1980 through 2017. Asia is projected to account for about 47% of the growth in global energy consumption through 2040.
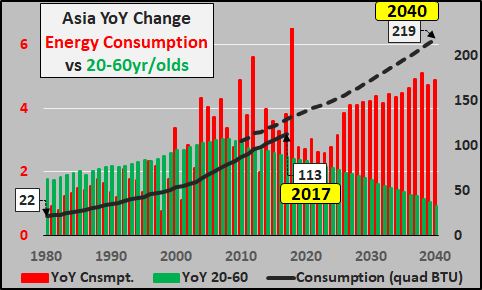
And adding total Asian energy consumption plus year over year changes in energy consumption vs. year over year changes in 20 to 60 year-old Asians. The decelerating growth versus expectations of accelerating energy consumption are illogical.
Births, childbearing females, and post childbearing females are all rapidly rising, though births are decelerating.
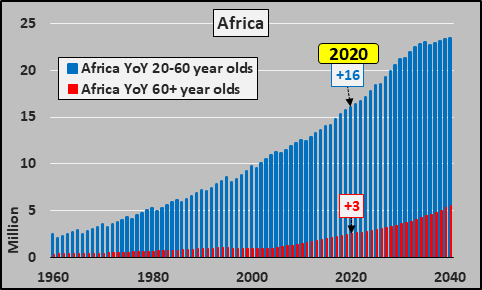
African annual working age population growth is rising rapidly but growth will be decelerating in the 2030’s before a peak in annual growth sometime around 2050. The 60+ year old annual growth is far slower than the other regions but beginning to accelerate.
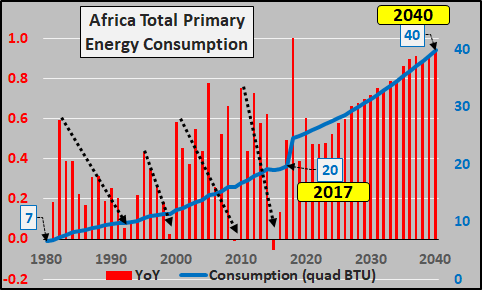
Africa consumes 3.4% of global energy. But critically, gauging by energy consumption, Africa is significantly more reliant on first world demand and far more impacted by first world slowdowns than Asia. This seems to imply that the 1 st world declines in demand and decelerating Asian growth will have outsized negative reverberations in Africa. This seems to suggest that Africa will suffer more than any other region in the next downturn and that it’s positive demographics will do little for it. Likewise, Africa’s population growth, primarily in Sub-Saharan Africa, has relatively little access to emigration due to extreme poverty coupled with geographic barriers of the Sahara Desert to the North and oceans all around. 
Below, 2018 through 2040 EIA energy consumption projections. While 1st world population and demand declines and Asia growth decelerates…Africa’s energy consumption is projected to grow at 250% the pace it did from 1980 through 2017. This does not seem credible and is likely entirely opposite the decelerating consumption growth that is likely to happen. Africa is projected to account for 9% of the growth in global primary energy consumption through 2040.
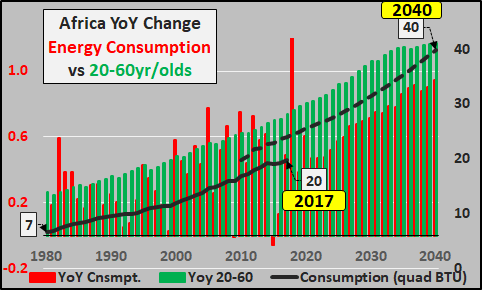
And adding total African energy consumption plus year over year changes in energy consumption vs. year over year changes in 20 to 60 year-old Africans.
Conclusion: It is fairly easy to suggest what will not happen going forward and what will happen instead. Population growth, particularly among 1st world and Asian working age populations, will decelerate and the impact on births will likely be greater than projected above. Energy consumption will almost surely grow far less than projected above with a fairly good potential for outright decline. Central banks and federal governments will continue to progressively intervene to artificially prop up demand and asset valuations amid a perpetually weakening architecture. The weaker organic demand is, the more interest rates will go down and asset prices will rise. Fundamentals and historical norms will be progressively less reliable as a centrally directed politicization of the economy, currency, and financial system continues to override free market capitalism.
What isn’t easy to say is how long this current propping proceeds before something breaks, what that break looks like, and what comes after the current system breaks down.
All population data is taken from the United Nations World Population Prospects 2019 report; energy data from the EIA data on Primary Energy Consumption (US Energy Information Administration) and EIA International Energy Outlook 2019 (future energy consumption projections).
Supplemental Data, by Nation:
China: $15.5 trillion GDP, 1.4 billion persons (18.5%) consume 24% global energy.
Total energy consumption (blue line), year over year consumption change (red column).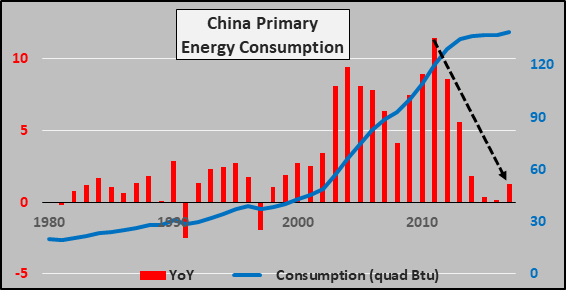
Annual Births, Childbearing, Post Childbearing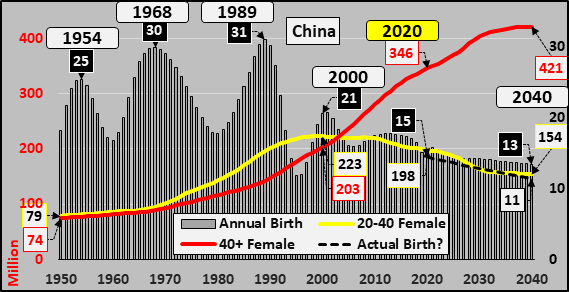
Annual Change; Working-age population, Post working-age population, Discount Rate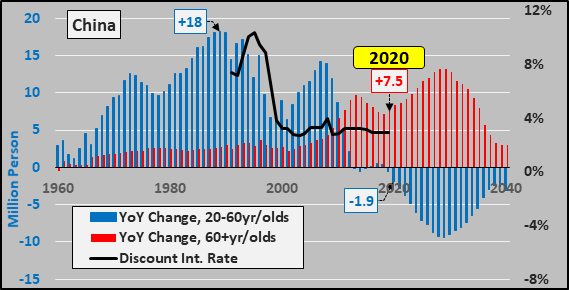
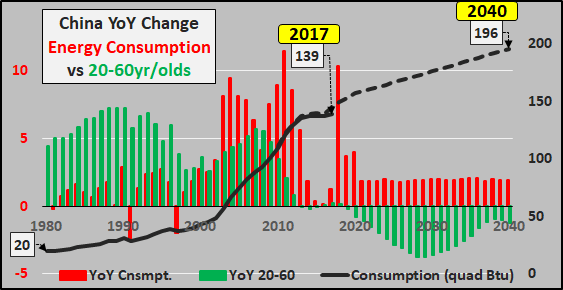
Below, total energy consumption (black line), projected consumption (dashed line), year over year change in consumption (red columns), and year over year 20 to 60 year-old population change (green columns).
Japan: $5.5 trillion GDP, 126 million persons (1.6%) consume 3.3% global energy.
Total energy consumption (blue line), year over year consumption change (red column).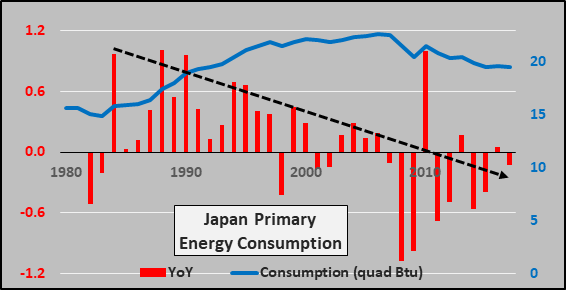
Annual Births, Childbearing, Post Childbearing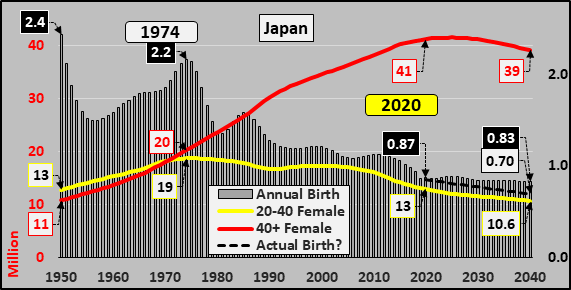
Annual Change; Working-age population, Post working-age population, Discount Rate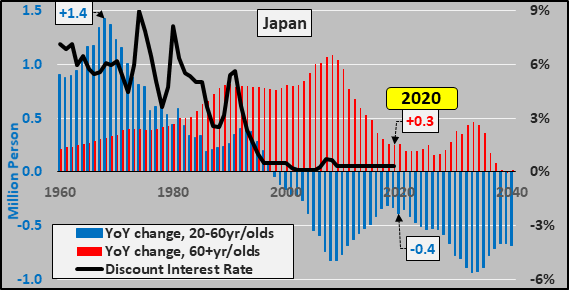
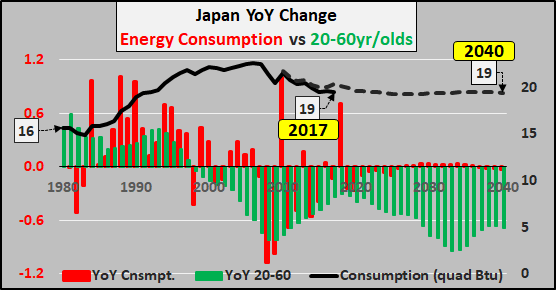
Below, total energy consumption (black line), projected consumption (dashed line), year over year change in consumption (red columns), and year over year 20 to 60 year-old population change (green columns).
South Korea: $1.75 trillion GDP, 51 million persons (0.7%) consume 2.1% global energy.
Total energy consumption (blue line), year over year consumption change (red column).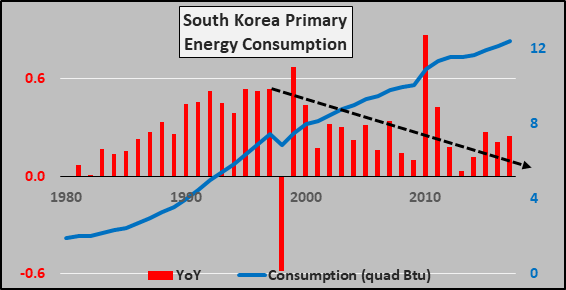
Annual Births, Childbearing, Post Childbearing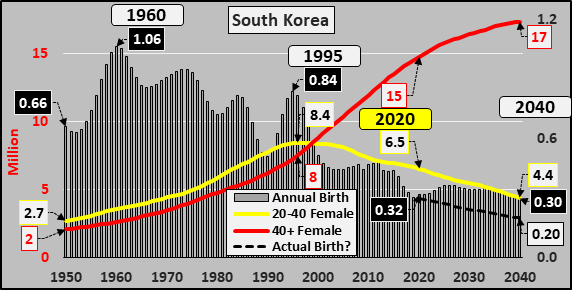
Annual Change; Working-age population, Post working-age population, Discount Rate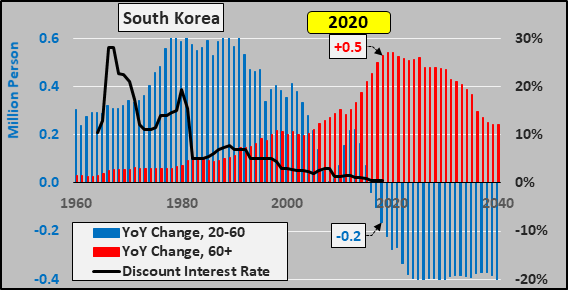
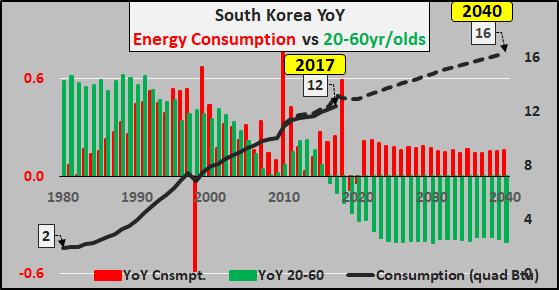
Below, total energy consumption (black line), projected consumption (dashed line), year over year change in consumption (red columns), and year over year 20 to 60 year-old population change (green columns).
Taiwan: $650 billion GDP, 24 million persons (0.3%) consume 0.8% global energy.
Total energy consumption (blue line), year over year consumption change (red column).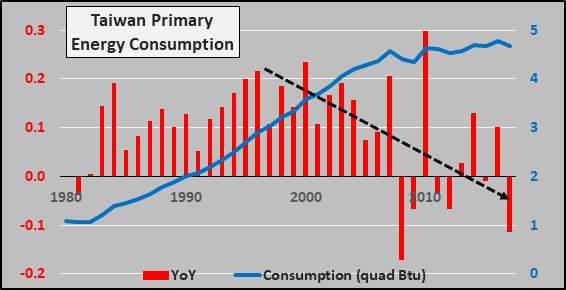
Annual Births, Childbearing, Post Childbearing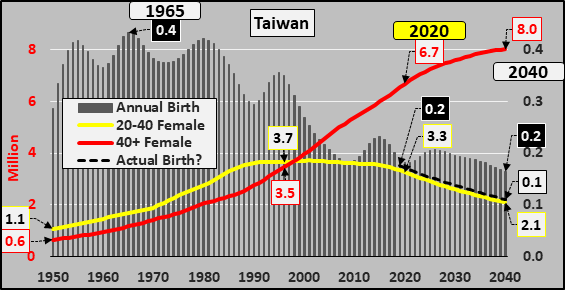
Annual Change; Working-age population, Post working-age population, Federal Res. Discount Rate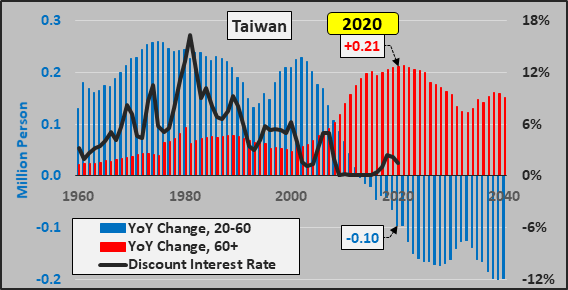
Germany: $4.1 trillion GDP, 84 million persons (1.1%) consume 2.4% global energy.
Total energy consumption (blue line), year over year consumption change (red column). Chart below from 1991 reunification through 2017. 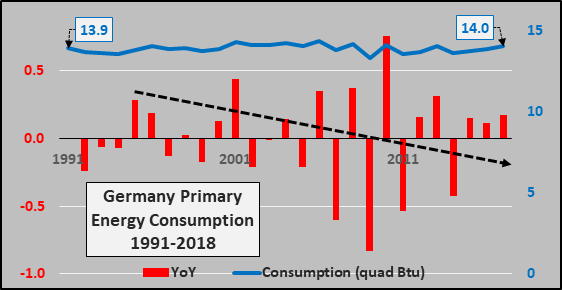
Annual Births, Childbearing, Post Childbearing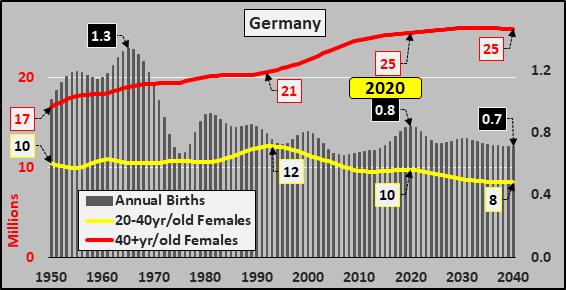
Annual Change; Working-age population, Post working-age population, Discount Rate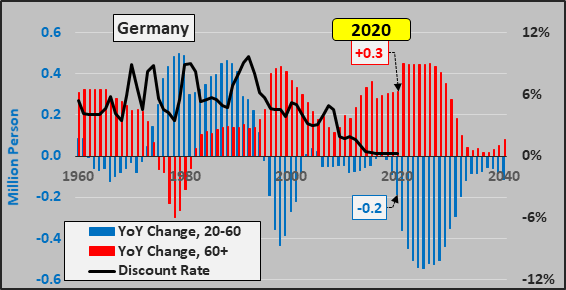
UK: $2.9 trillion GDP, 68 million persons (0.9%) consume 1.4% global energy.
Total energy consumption (blue line), year over year consumption change (red column).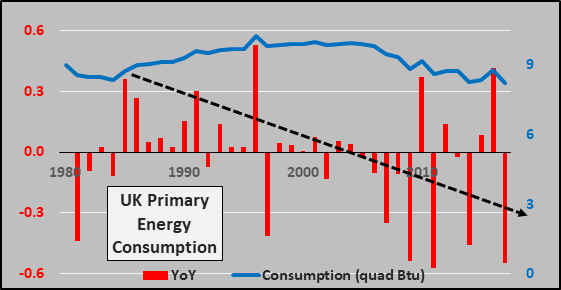
Annual Births, Childbearing, Post Childbearing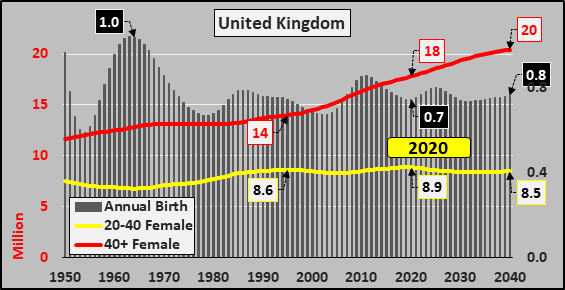
Annual Change; Working-age population, Post working-age population, Discount Rate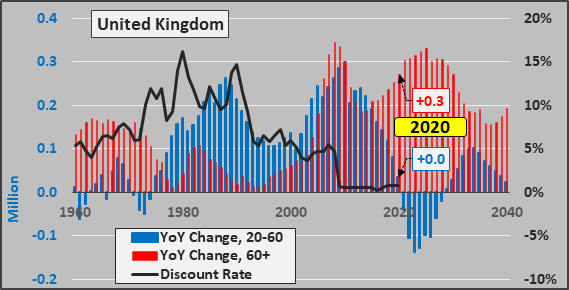
France: $2.8 trillion GDP, 65 million persons (0.8%) consume 1.8% global energy.
Total energy consumption (blue line), year over year consumption change (red column).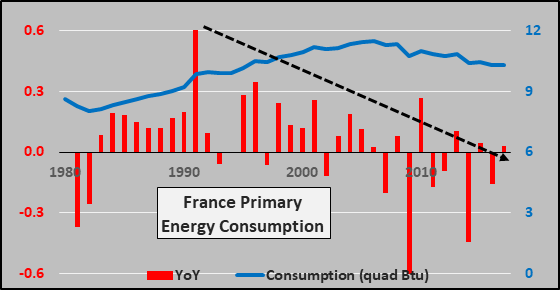
Annual Births, Childbearing, Post Childbearing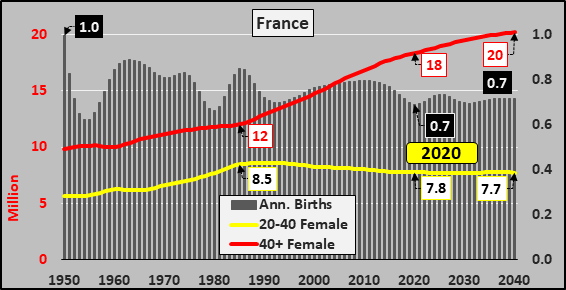
Annual Change; Working-age population, Post working-age population, Discount Rate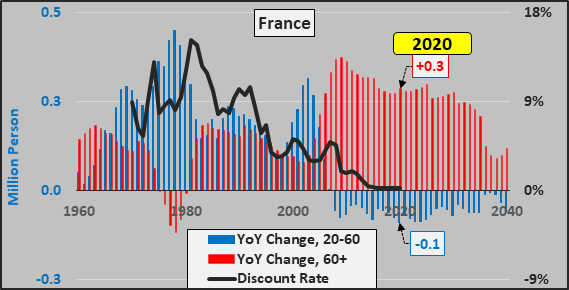
Italy: $2.1 trillion GDP, 60 million persons (0.8%) consume 1.2% global energy.
Total energy consumption (blue line), year over year consumption change (red column).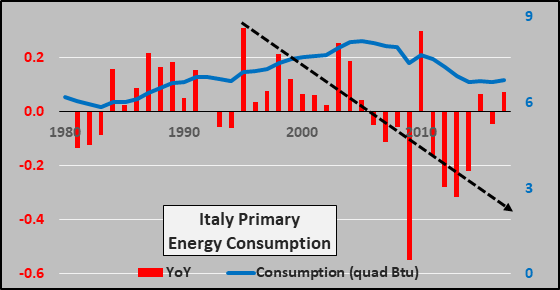
Annual Births, Childbearing, Post Childbearing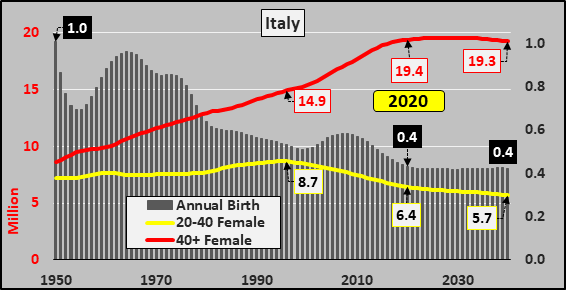
Annual Change; Working-age population, Post working-age population, Discount Rate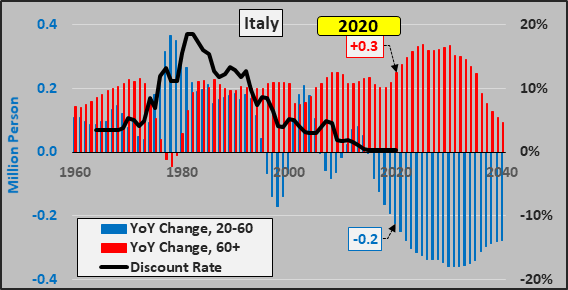
Spain: $1.5 trillion GDP, 47 million persons (0.6%) consume 1% global energy.
Total energy consumption (blue line), year over year consumption change (red column).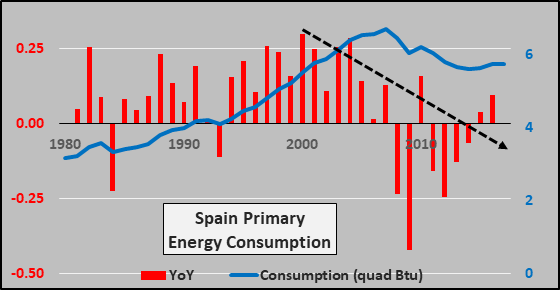
Annual Births, Childbearing, Post Childbearing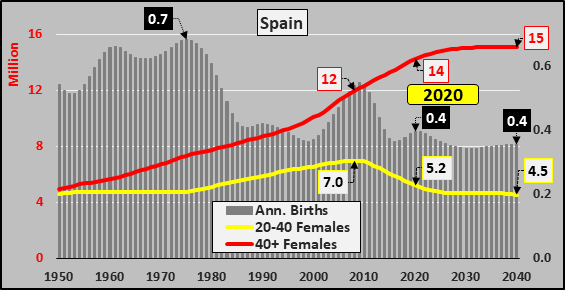
Annual Change; Working-age population, Post working-age population, Discount Rate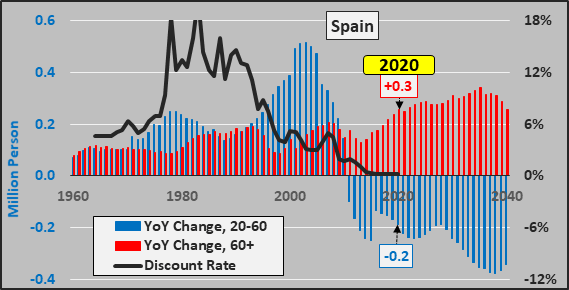
Netherlands: $950 billion GDP, 17 million person (0.2%) consume 0.7% global energy.
Total energy consumption (blue line), year over year consumption change (red column).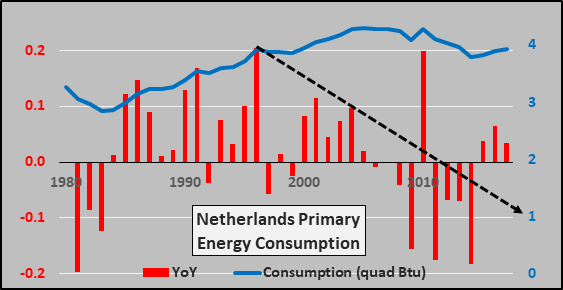
Annual Births, Childbearing, Post Childbearing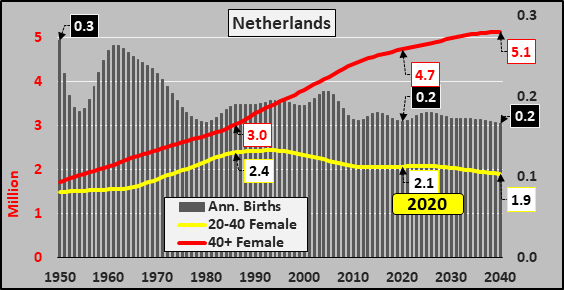
Annual Change; Working-age population, Post working-age population, Discount Rate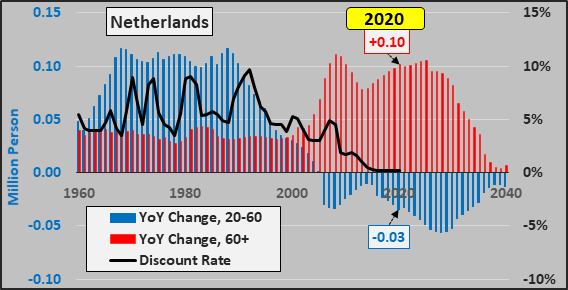
Switzerland: $750 billion GDP, 9 million persons (0.1%) consume 0.2% global energy.
Total energy consumption (blue line), year over year consumption change (red column).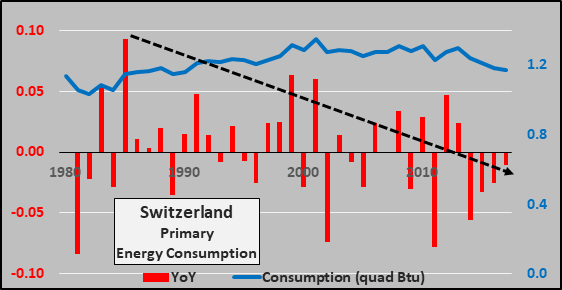
Annual Births, Childbearing, Post Childbearing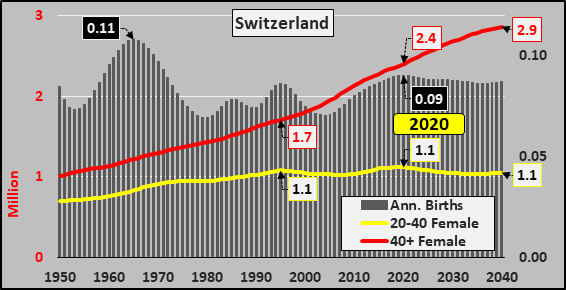
Annual Change; Working-age population, Post working-age population, Discount Rate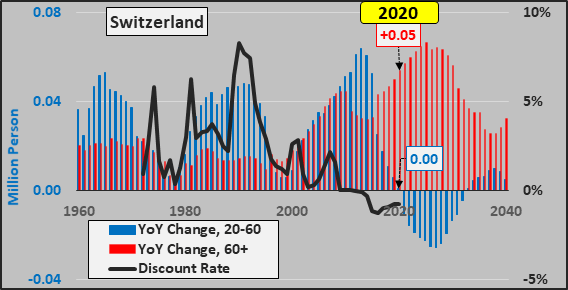
Sweden: $575 billion GDP, 10 million persons (0.1%) consume 0.4% global energy.
Total energy consumption (blue line), year over year consumption change (red column).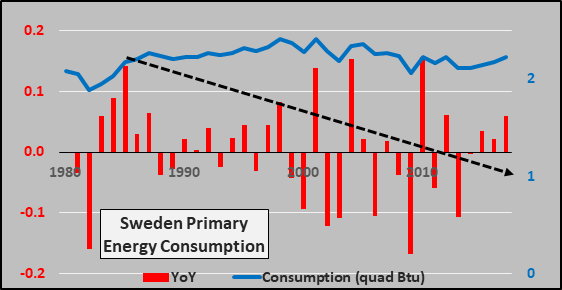
Annual Births, Childbearing, Post Childbearing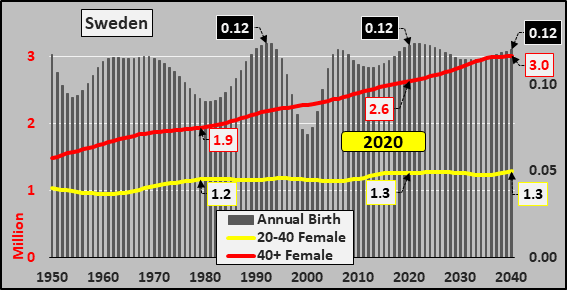
Annual Change; Working-age population, Post working-age population, Discount Rate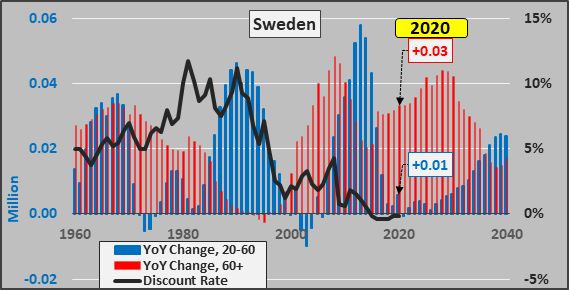
Belgium: $550 billion GDP, 12 million persons (0.15%) consume 0.5% global energy.
Total energy consumption (blue line), year over year consumption change (red column).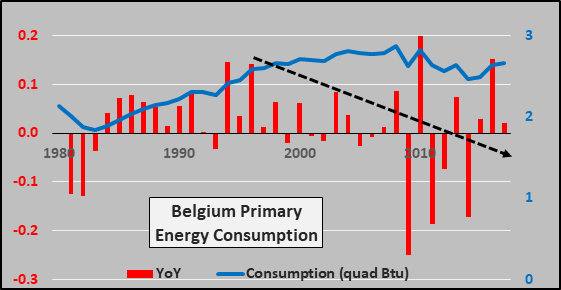
Annual Births, Childbearing, Post Childbearing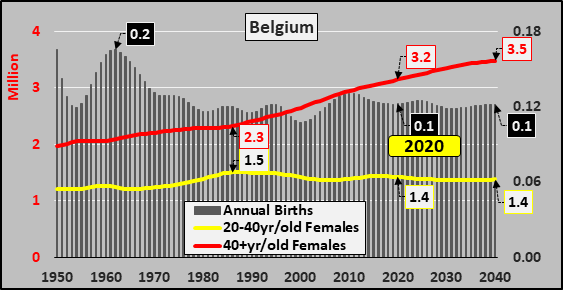
Annual Change; Working-age population, Post working-age population, German Discount Rate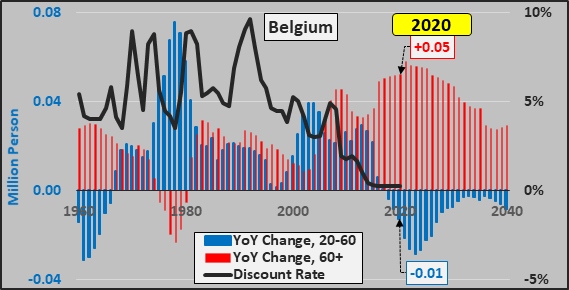
Austria: $500 billion GDP, 9 million persons (0.1%) consume 0.26% global energy.
Total energy consumption (blue line), year over year consumption change (red column).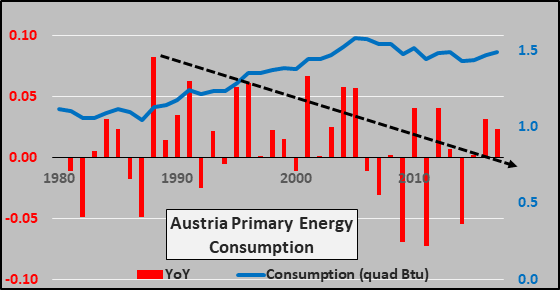
Annual Births, Childbearing, Post Childbearing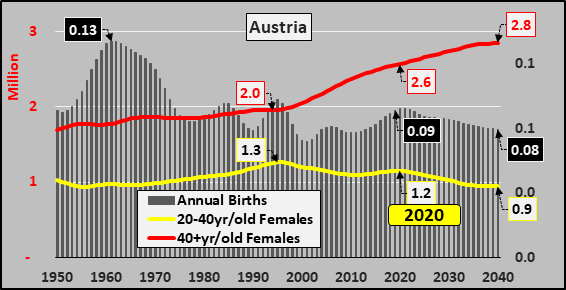
Annual Change; Working-age population, Post working-age population, German Discount Rate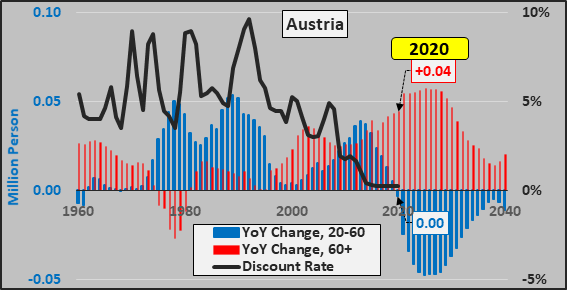
Greece: $225 billion GDP, 10 million persons (0.1%) consume 0.2% global energy.
Total energy consumption (blue line), year over year consumption change (red column).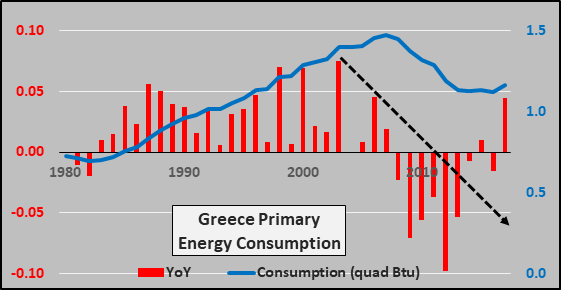
Annual Births, Childbearing, Post Childbearing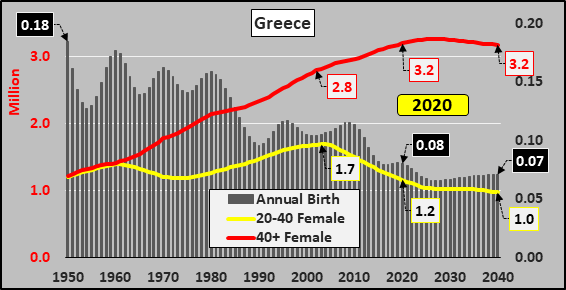
Annual Change; Working-age population, Post working-age population, Discount Rate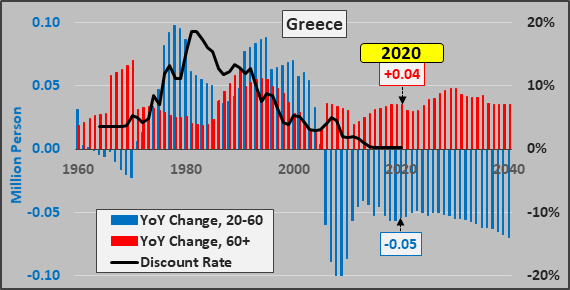
Russia: $1.7 trillion GDP, 146 million persons (1.9%) consume 5.6% global energy.
Total energy consumption (blue line), year over year consumption change (red column).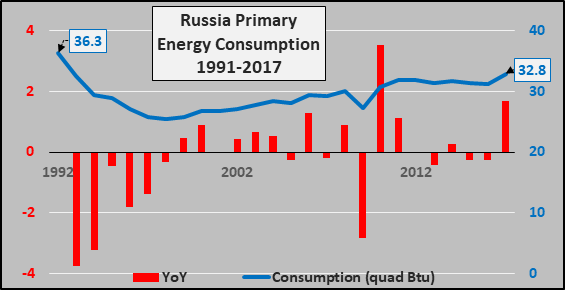
Annual Births, Childbearing, Post Childbearing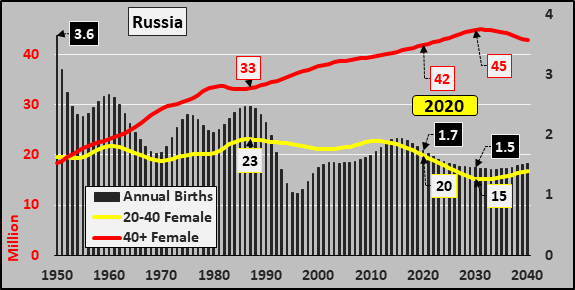
Annual Change; Working-age population, Post working-age population, Discount Rate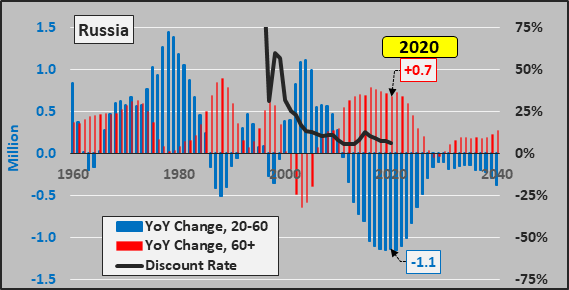
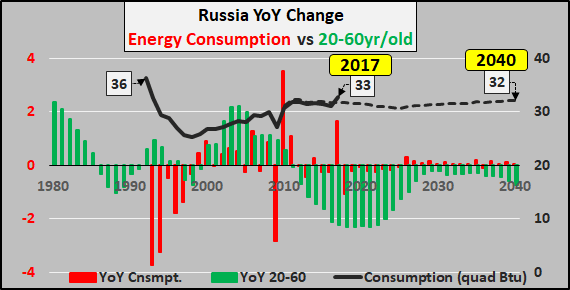
Below, total energy consumption (black line), projected consumption (dashed line), year over year change in consumption (red columns), and year over year 20 to 60 year-old population change (green columns).
Poland: $650 billion GDP, 38 million persons (0.5%) consume 0.7% global energy.
Total energy consumption (blue line), year over year consumption change (red column).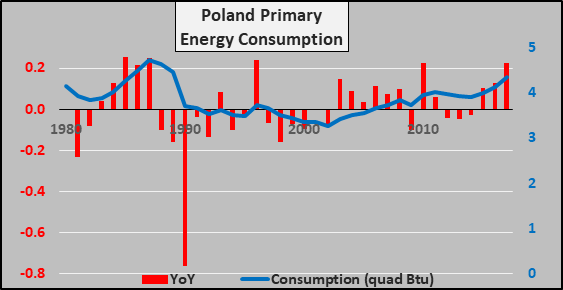
Annual Births, Childbearing, Post Childbearing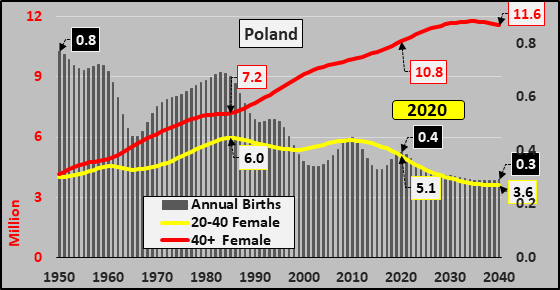
Annual Change; Working-age population, Post working-age population, Discount Rate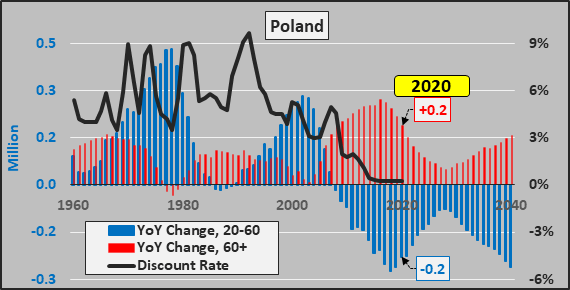
Canada: $1.8 trillion GDP, 38 million persons (0.5%) consume 2.6% global energy.
Total energy consumption (blue line), year over year consumption change (red column).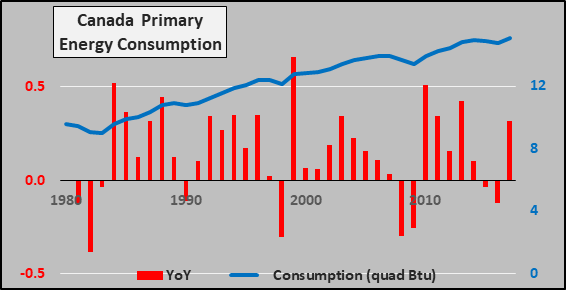
Annual Births, Childbearing, Post Childbearing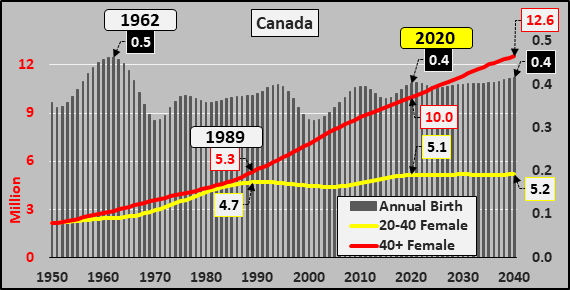
Annual Change; Working-age population, Post working-age population, Discount Rate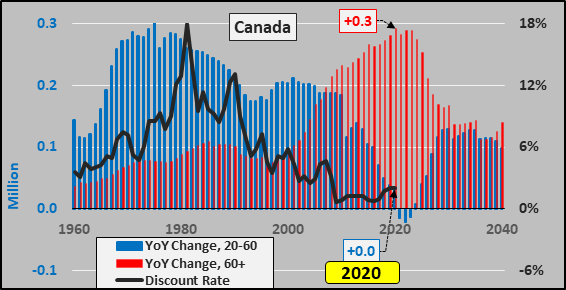
US of A: $22 trillion GDP, 330 million persons (4.3%) consume 17% global energy
Total energy consumption (blue line), year over year consumption change (red column).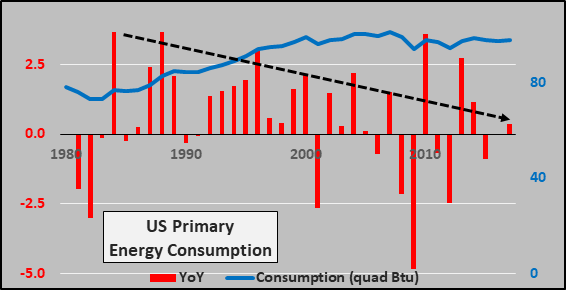
Annual Births, Childbearing, Post Childbearing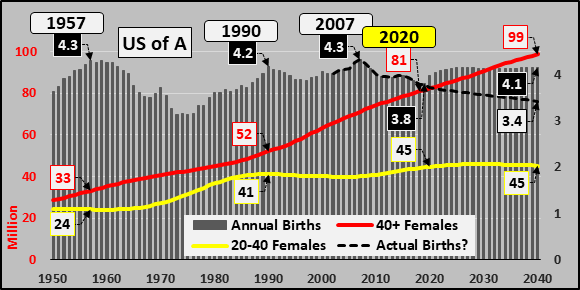
Annual Change; Working-age population, Post working-age population, Discount Rate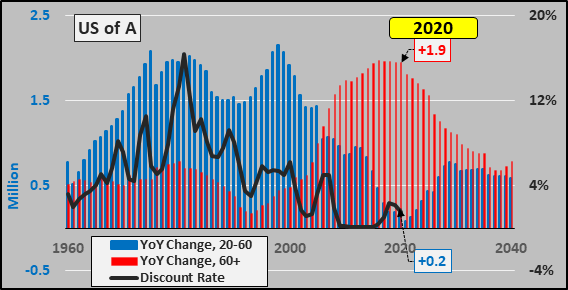
Below, total energy consumption (black line), projected consumption (dashed line), year over year change in consumption (red columns), and year over year 20 to 60 year-old population change (green columns).
Australia: $1.5 trillion GDP, 26 million persons (0.3%) consume 1.1%…New Zealand: $225 billion GDP, 5 million persons (0.06%) consume 0.2% global energy
Total energy consumption (blue line), year over year consumption change (red column).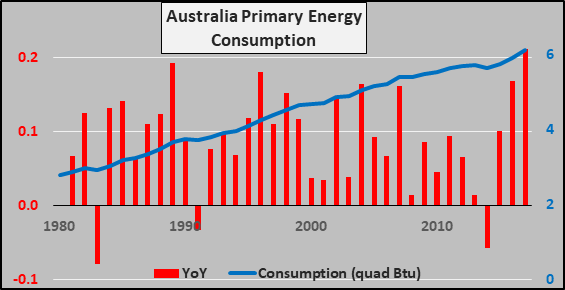
Total energy consumption (blue line), year over year consumption change (red column).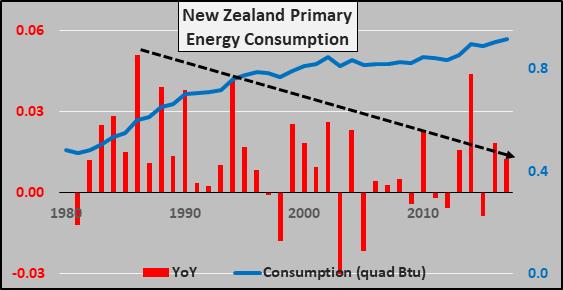
Annual Births, Childbearing, Post Childbearing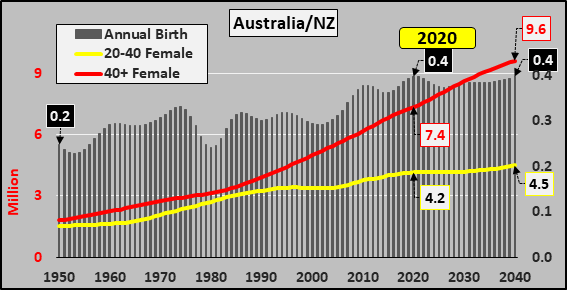
Annual Change; Working-age population, Post working-age population, Discount Rate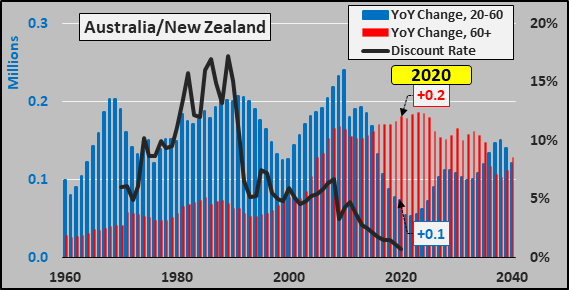
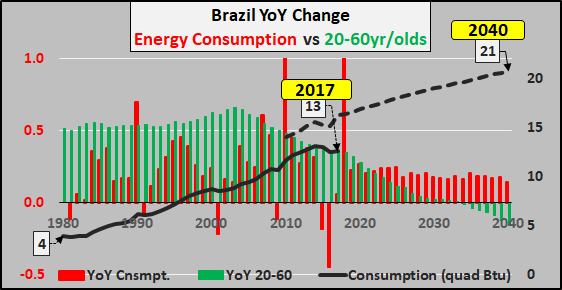
Brazil: $2.1 trillion GDP, 213 million persons (2.7%) consume 2.2% global energy
Total energy consumption (blue line), year over year consumption change (red column).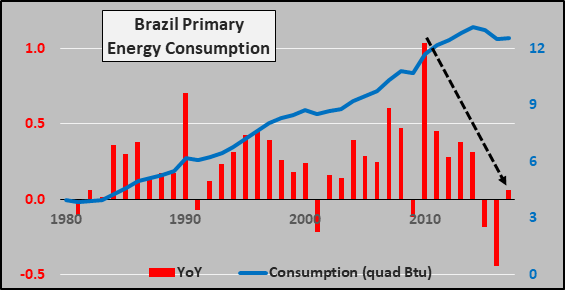
Annual Births, Childbearing, Post Childbearing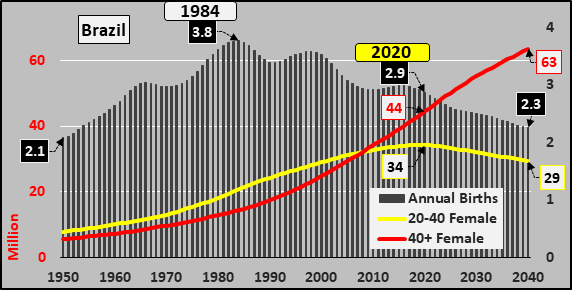
Annual Change; Working-age population, Post working-age population, Discount Rate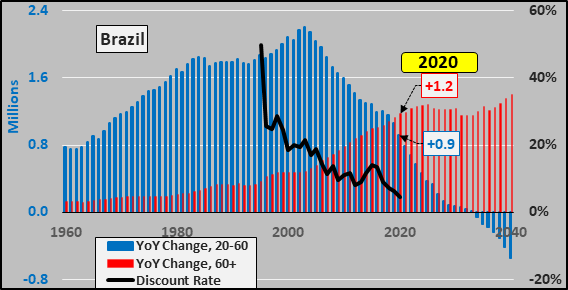
Below, total energy consumption (black line), projected consumption (dashed line), year over year change in consumption (red columns), and year over year 20 to 60 year-old population change (green columns).
Mexico: $1.3 trillion GDP, 129 million persons (1.65%) consume 1.4% global energy.
Total energy consumption (blue line), year over year consumption change (red column).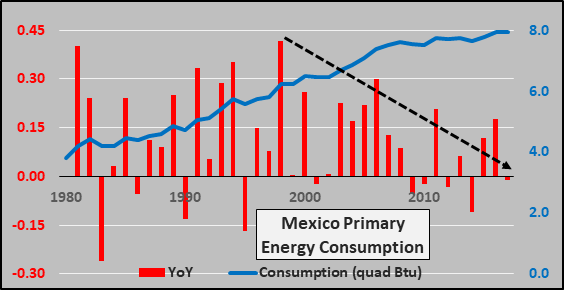
Annual Births, Childbearing, Post Childbearing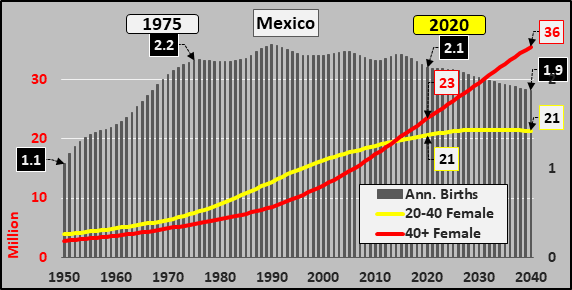
Annual Change; Working-age population, Post working-age population, Discount Rate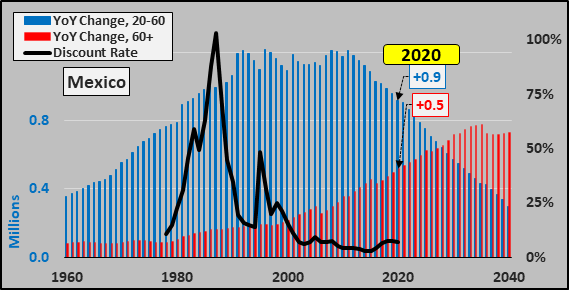
Argentina: $500 billion GDP, 45 million persons (0.6%) consume 0.7% global energy.
Total energy consumption (blue line), year over year consumption change (red column).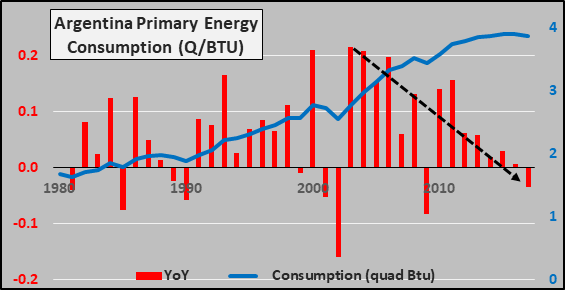
Annual Births, Childbearing, Post Childbearing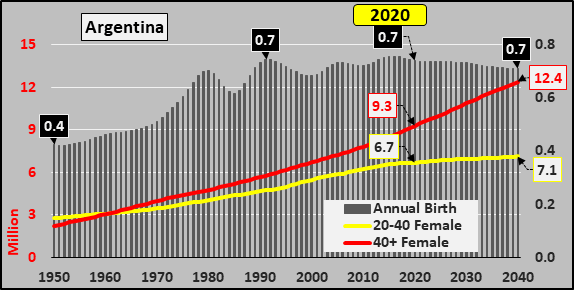
Annual Change; Working-age population, Post working-age population, Discount Rate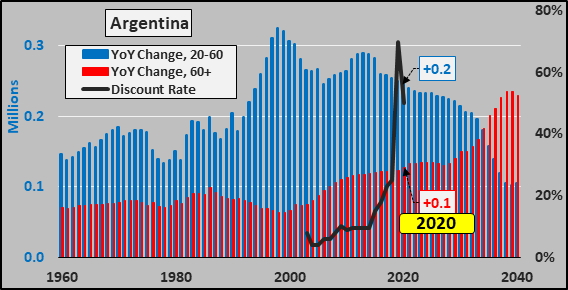
Colombia: $350 billion GDP, 51 million persons (0.65%) consume 0.3% global energy.
Total energy consumption (blue line), year over year consumption change (red column).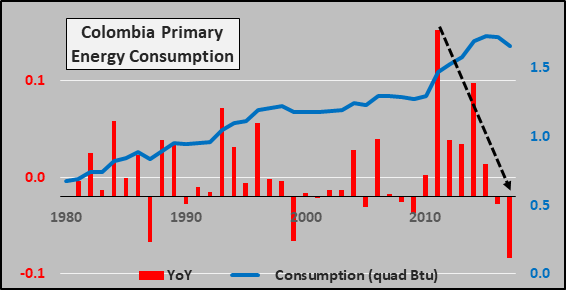
Annual Births, Childbearing, Post Childbearing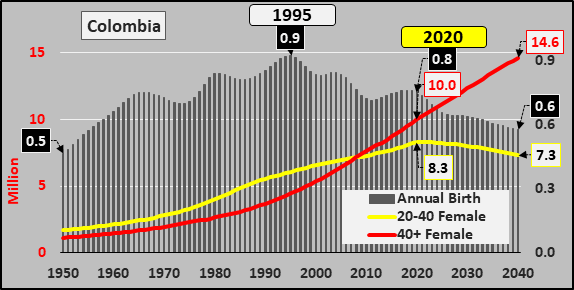
Annual Change; Working-age population, Post working-age population, Discount Rate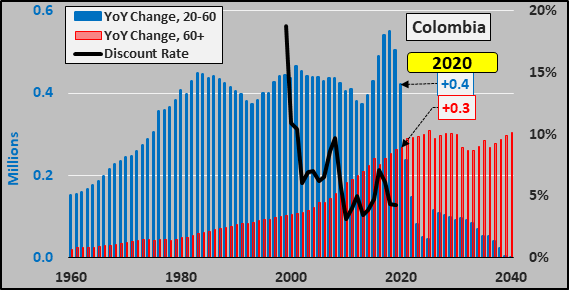
Chile: $315 billion GDP, 19 million persons (0.25%) consume 0.26% global energy.
Total energy consumption (blue line), year over year consumption change (red column).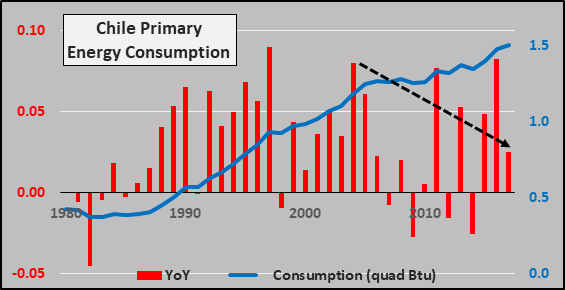
Annual Births, Childbearing, Post Childbearing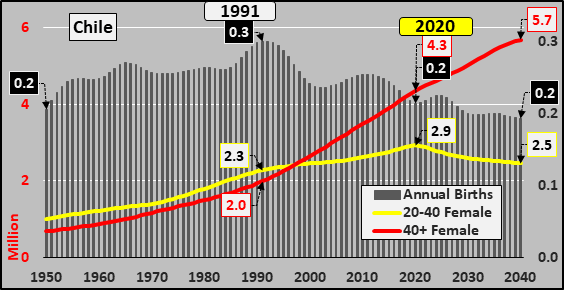
Annual Change; Working-age population, Post working-age population, Discount Rate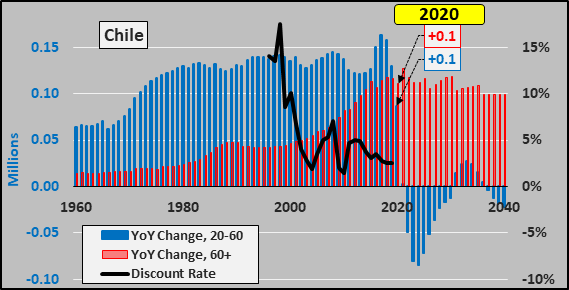
Peru: $240 billion GDP, 33 million persons (0.4%) consume 0.2% global energy.
Total energy consumption (blue line), year over year consumption change (red column).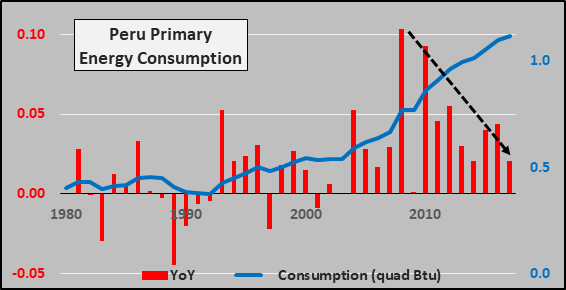
Annual Births, Childbearing, Post Childbearing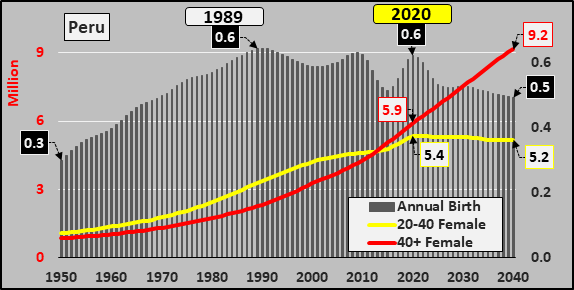
Annual Change; Working-age population, Post working-age population, Discount Rate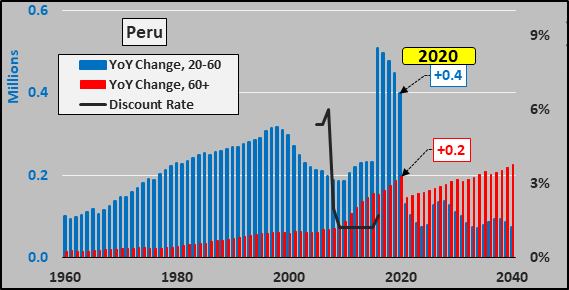
Ecuador: $110 billion GDP, 18 million persons (0.23%) consume 0.12% global energy.
Total energy consumption (blue line), year over year consumption change (red column).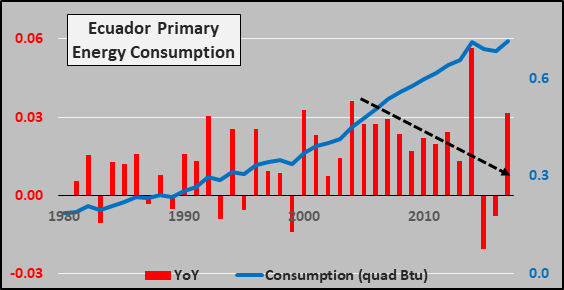
Annual Births, Childbearing, Post Childbearing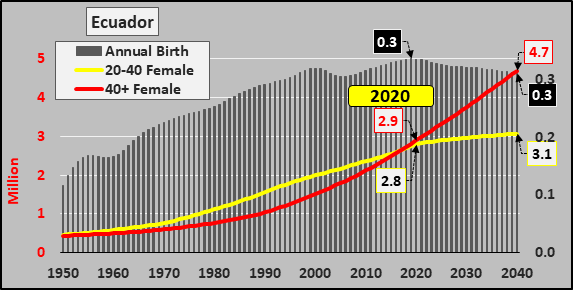
Annual Change; Working-age population, Post working-age population, Discount Rate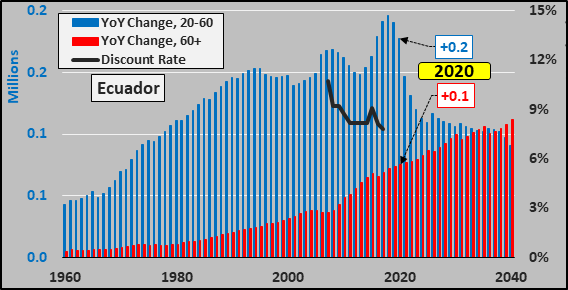
Venezuela: $70 billion GDP, 28 million persons (0.36%) consume 0.4% global energy.
Total energy consumption (blue line), year over year consumption change (red column).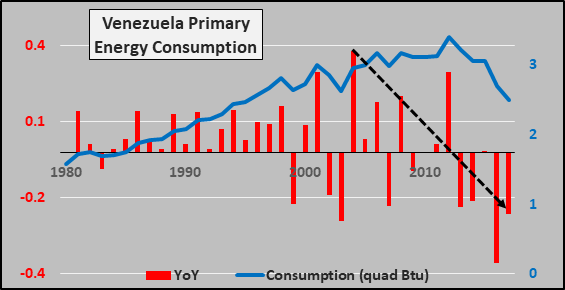
Annual Births, Childbearing, Post Childbearing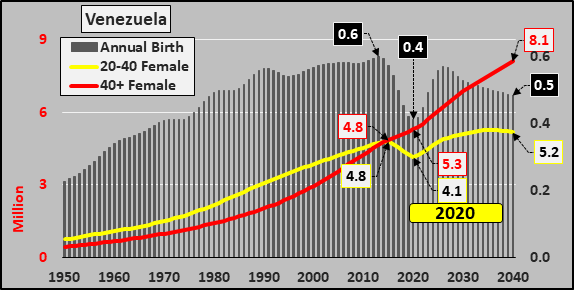
Annual Change; Working-age population, Post working-age population, Discount Rate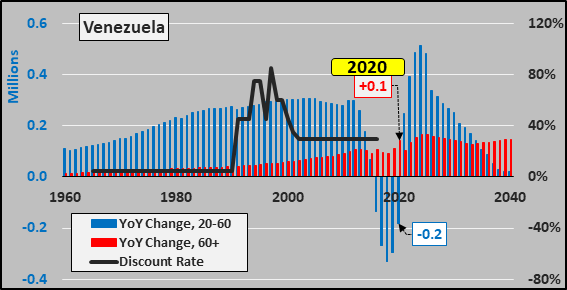
Dominican Republic: $90 billion GDP, 11 million persons (0.14%) consume 0.06% global energy.
Total energy consumption (blue line), year over year consumption change (red column).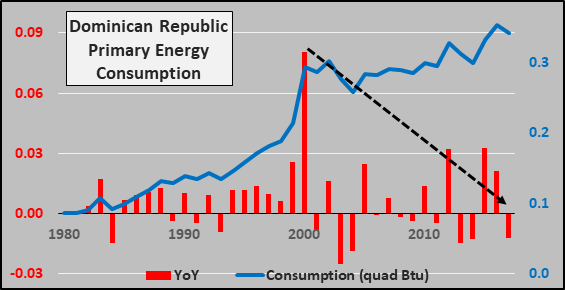
Annual Births, Childbearing, Post Childbearing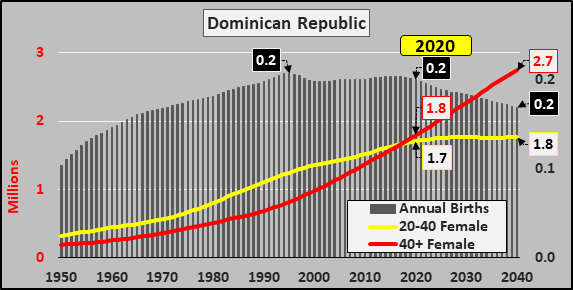
Guatemala: $85 billion GDP, 18 million persons (0.23%) consume 0.05% global energy.
Total energy consumption (blue line), year over year consumption change (red column).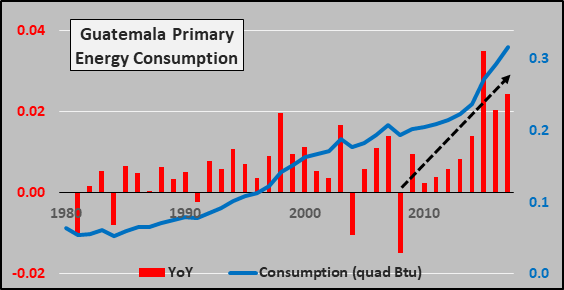
Annual Births, Childbearing, Post Childbearing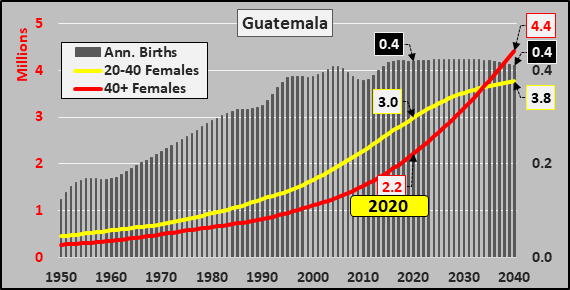
India: $3.3 trillion GDP, 1.38 billion persons (17.7%) consume 5.2% global energy.
Total energy consumption (blue line), year over year consumption change (red column).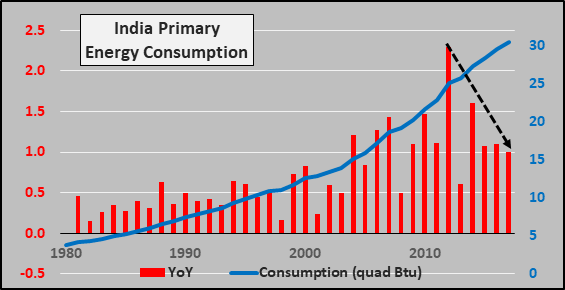
Annual Births, Childbearing, Post Childbearing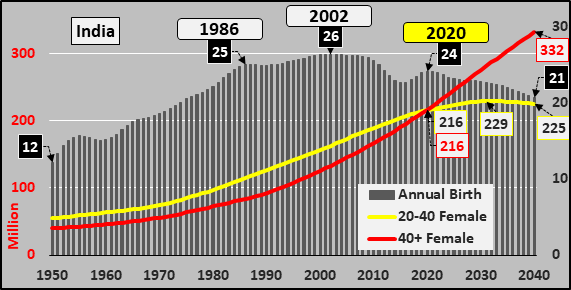
Annual Change; Working-age population, Post working-age population, Discount Rate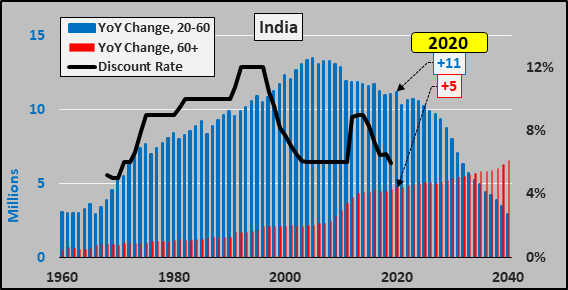
Below, total energy consumption (black line), projected consumption (dashed line), year over year change in consumption (red columns), and year over year 20 to 60 year-old population change (green columns).
Indonesia: $1.2 trillion GDP, 274 million persons (3.5%) consume 1.2% global energy.
Total energy consumption (blue line), year over year consumption change (red column).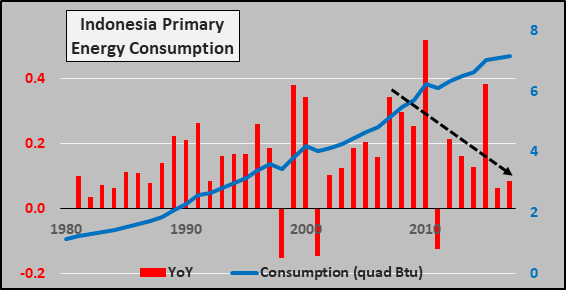
Annual Births, Childbearing, Post Childbearing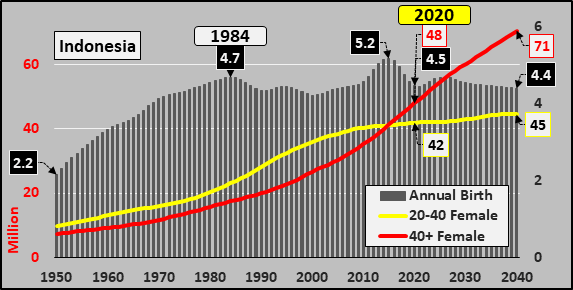
Annual Change; Working-age population, Post working-age population, Discount Rate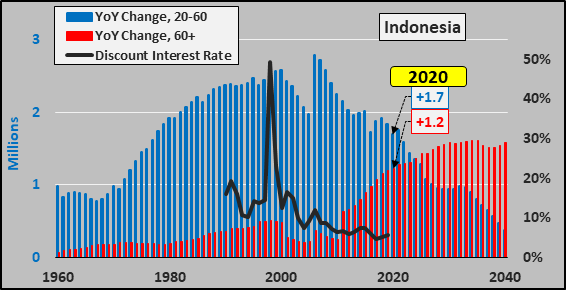
Turkey: $810 billion GDP, 84 million persons (1.1%) consume 1.1% global energy.
Total energy consumption (blue line), year over year consumption change (red column).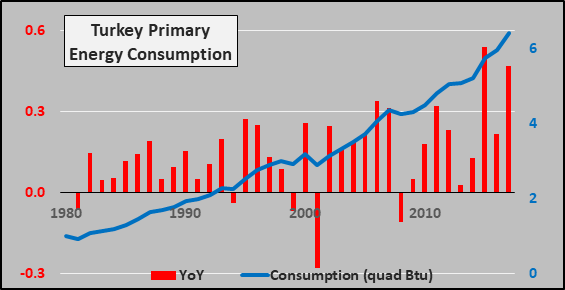
Annual Births, Childbearing, Post Childbearing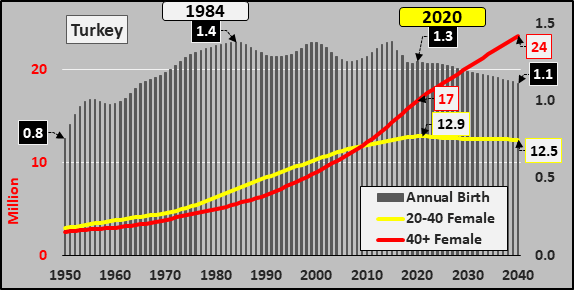
Annual Change; Working-age population, Post working-age population, Discount Rate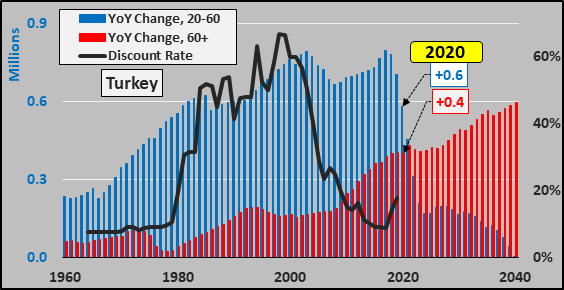
Saudi Arabia: $790 billion GDP, 35 million person (0.45%) consume 1.9% global energy.
Total energy consumption (blue line), year over year consumption change (red column).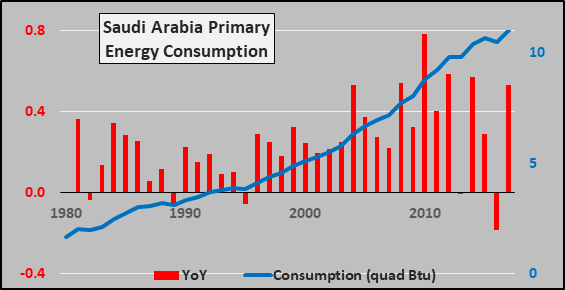
Annual Births, Childbearing, Post Childbearing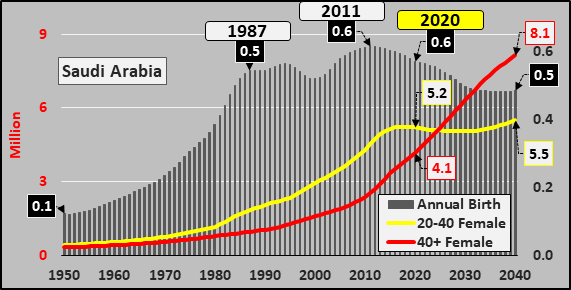
Annual Change; Working-age population, Post working-age population, Discount Rate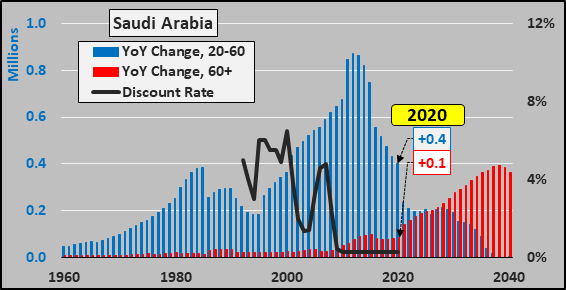
Iran: $500 billion GDP, 84 million persons (1.1%) consume 2% global energy.
Total energy consumption (blue line), year over year consumption change (red column).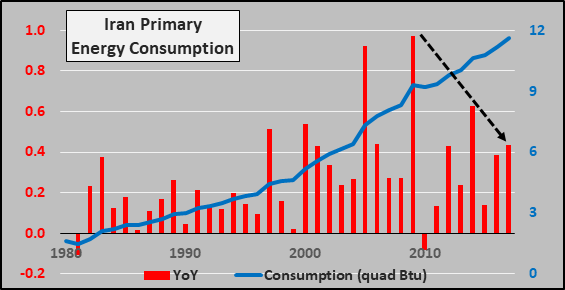
Annual Births, Childbearing, Post Childbearing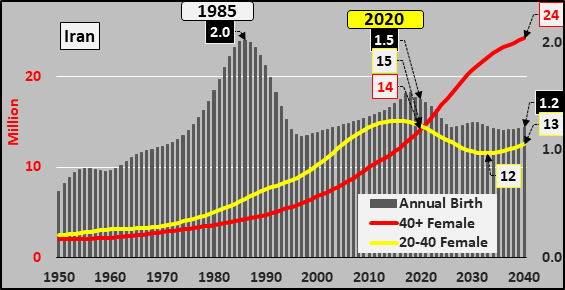
Annual Change; Working-age population, Post working-age population, Discount Rate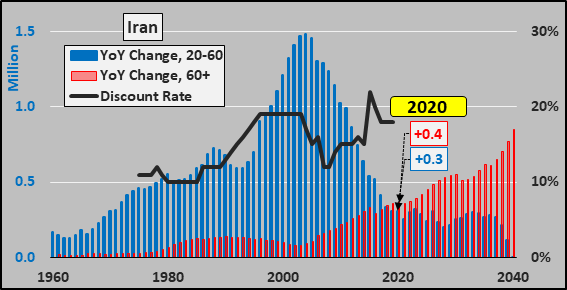
Thailand: $550 billion GDP, 70 million persons (0.9%) consume 0.9% global energy.
Total energy consumption (blue line), year over year consumption change (red column).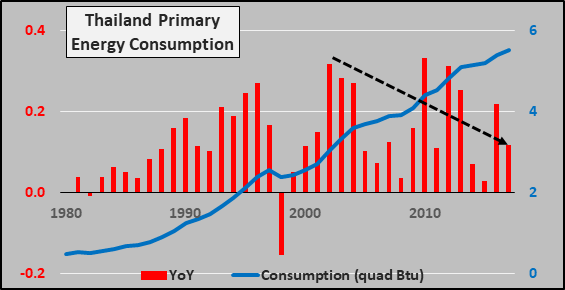
Annual Births, Childbearing, Post Childbearing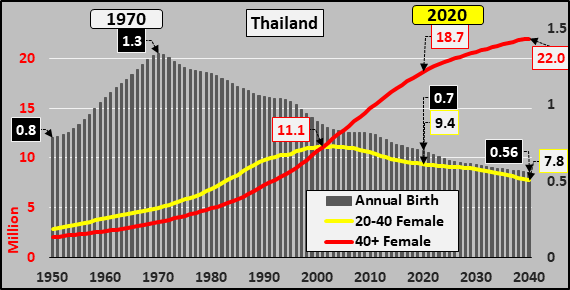
Annual Change; Working-age population, Post working-age population, Discount Rate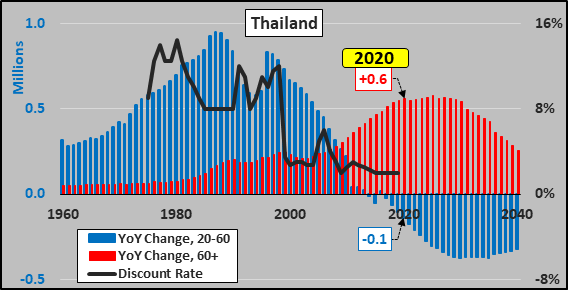
Pakistan: $350 billion GDP, 221 million persons (2.8%) consume 0.55% global energy.
Total energy consumption (blue line), year over year consumption change (red column).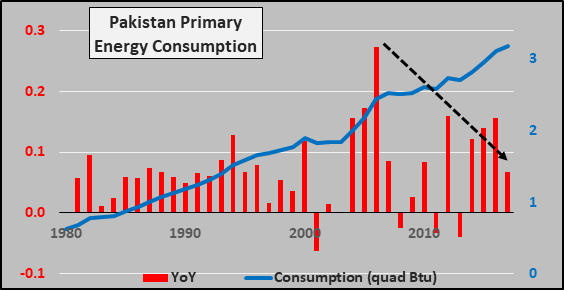
Annual Births, Childbearing, Post Childbearing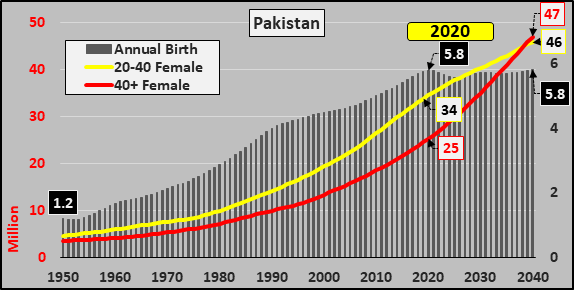
Annual Change; Working-age population, Post working-age population, Discount Rate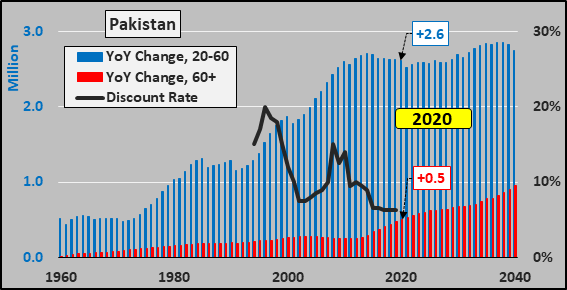
Malaysia: $400 billion GDP, 32 million persons (0.4%) consume 0.6% global energy.
Total energy consumption (blue line), year over year consumption change (red column).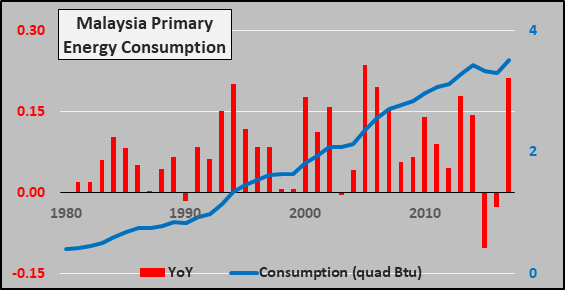
Annual Births, Childbearing, Post Childbearing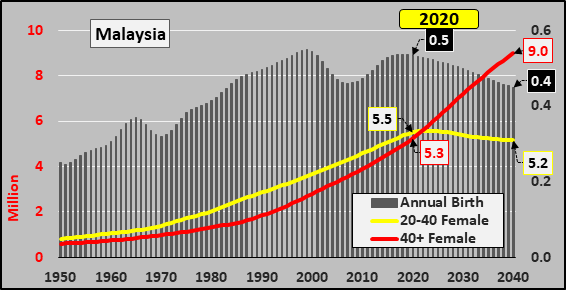
Annual Change; Working-age population, Post working-age population, Discount Rate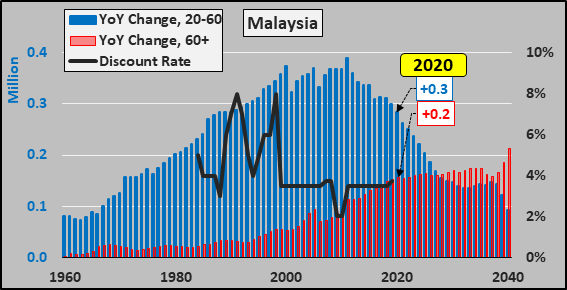
Philippines: $390 billion GDP, 110 million persons (1.4%) consume 0.3% global energy.
Total energy consumption (blue line), year over year consumption change (red column).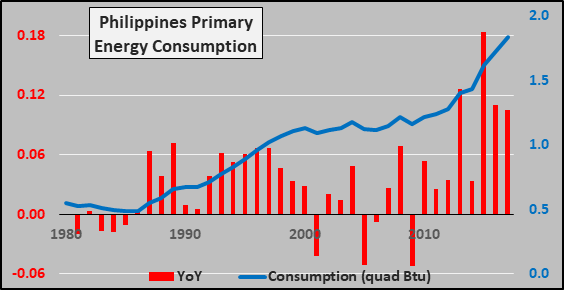
Annual Births, Childbearing, Post Childbearing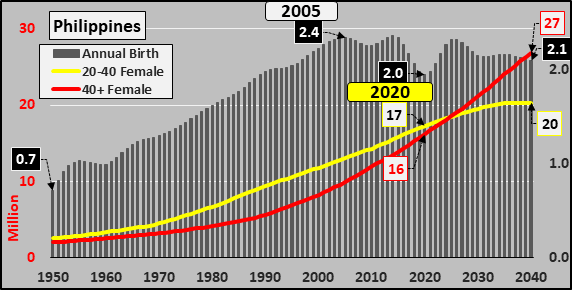
Annual Change; Working-age population, Post working-age population, Discount Rate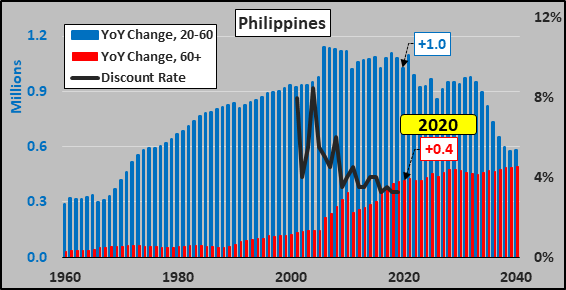
Vietnam: $280 billion GDP, 97 million persons (1.25%) consumes 0.6% global energy.
Total energy consumption (blue line), year over year consumption change (red column).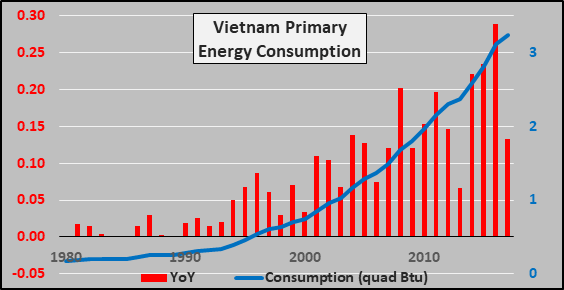
Annual Births, Childbearing, Post Childbearing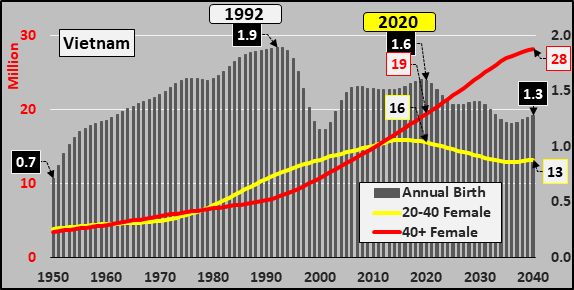
Annual Change; Working-age population, Post working-age population, Discount Rate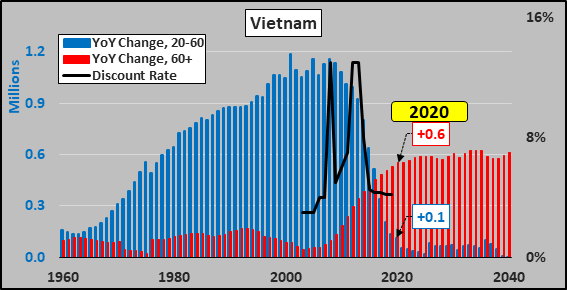
Bangladesh: $250 billion GDP, 165 million persons (2.1%) consume 0.25% global energy.
Total energy consumption (blue line), year over year consumption change (red column).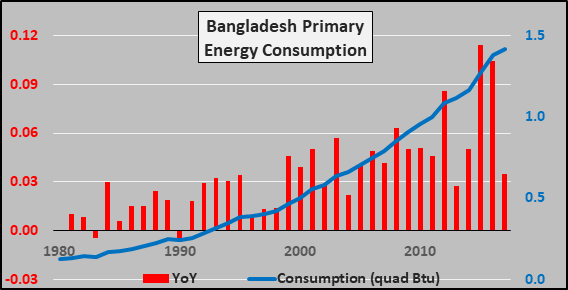 Annual Births, Childbearing, Post Childbearing
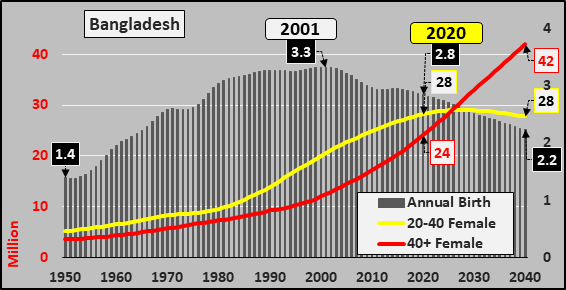 Annual Change; Working-age population, Post working-age population, Discount Rate
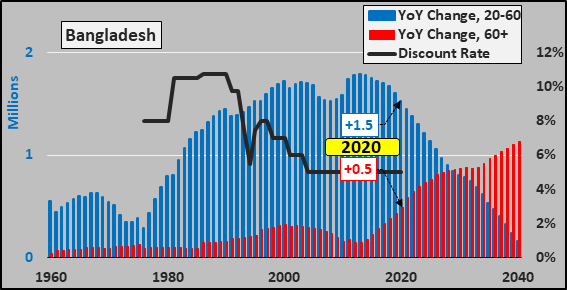
Nigeria: $500 billion GDP, 206 million persons (2.65%) consume 0.26% global energy.
Total energy consumption (blue line), year over year consumption change (red column).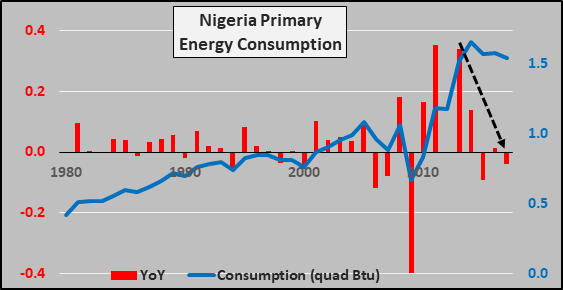
Annual Births, Childbearing, Post Childbearing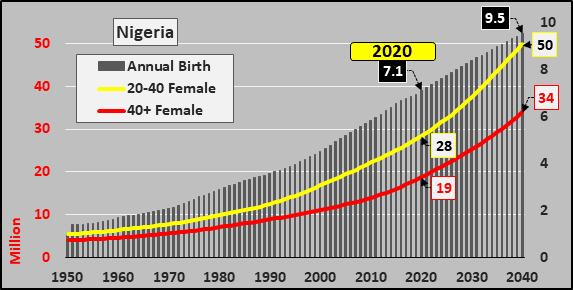
Annual Change; Working-age population, Post working-age population, Discount Rate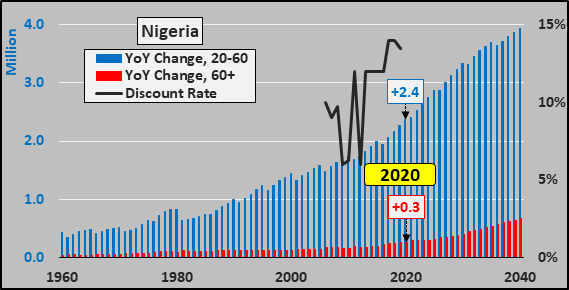
South Africa: $390 billion GDP, 59 million persons (0.75%) consume 1% global energy.
Total energy consumption (blue line), year over year consumption change (red column).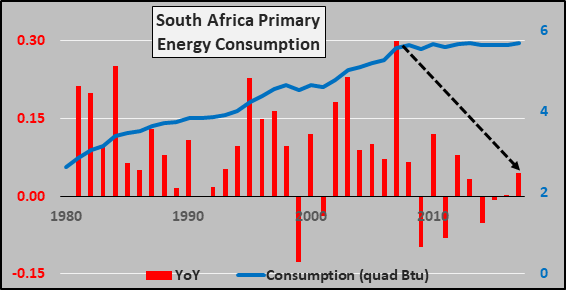
Annual Births, Childbearing, Post Childbearing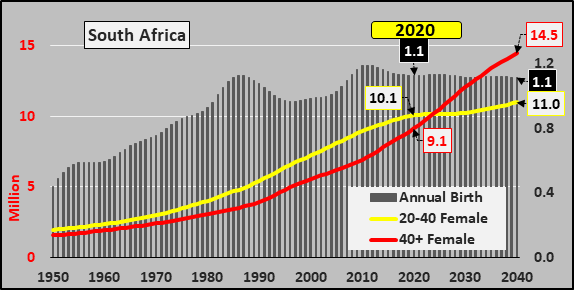
Annual Change; Working-age population, Post working-age population, Discount Rate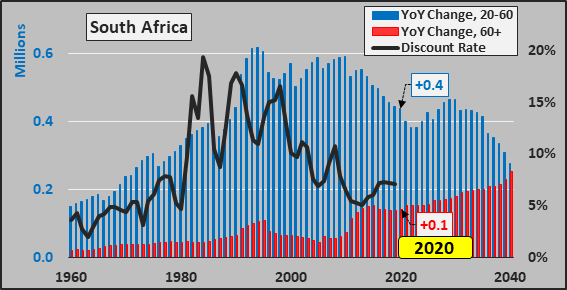
Egypt: $330 billion GDP, 102 million persons (1.3%) consume 0.7% global energy.
Total energy consumption (blue line), year over year consumption change (red column).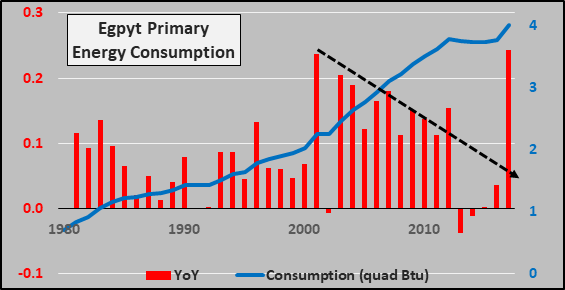
Annual Births, Childbearing, Post Childbearing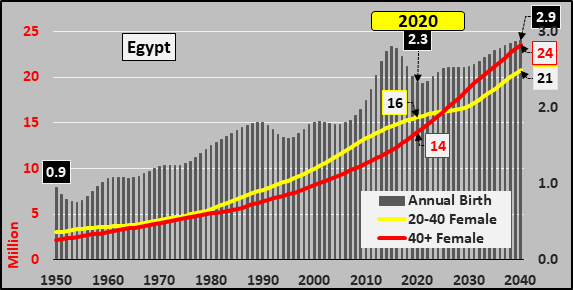
Annual Change; Working-age population, Post working-age population, Discount Rate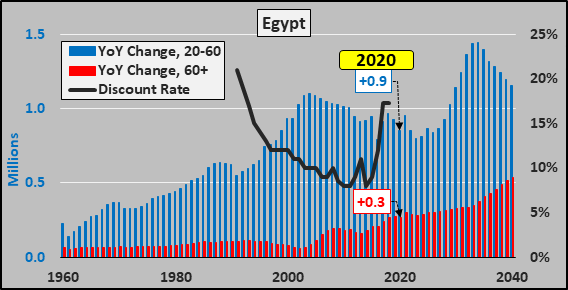
Algeria: $190 billion GDP, 44 million persons (0.55%) consumes 0.4% global energy.
Total energy consumption (blue line), year over year consumption change (red column).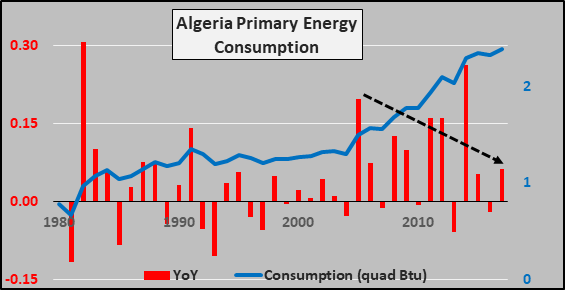
Annual Births, Childbearing, Post Childbearing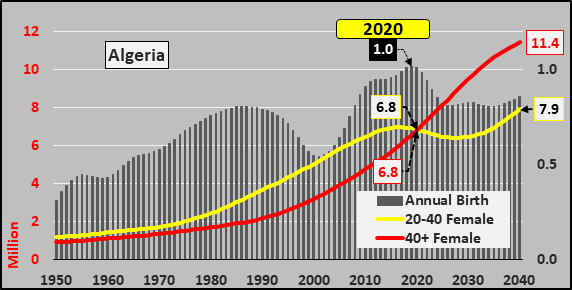
Annual Change; Working-age population, Post working-age population, Discount Rate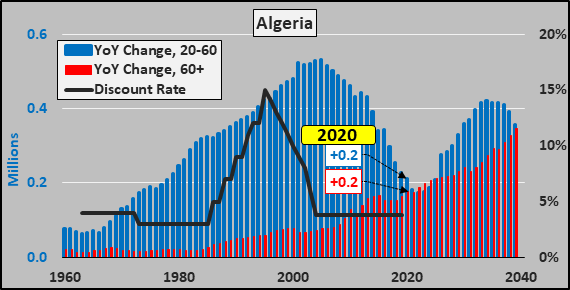
Morocco: $130 billion GDP, 37 million persons (0.5%) consume 1.4% global energy.
Total energy consumption (blue line), year over year consumption change (red column).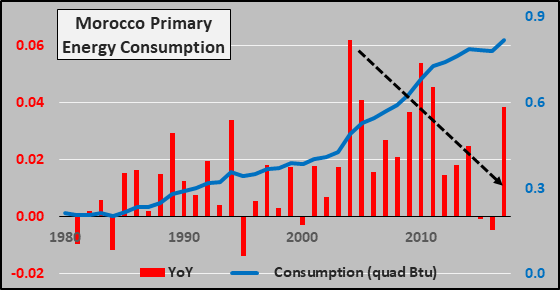
Annual Births, Childbearing, Post Childbearing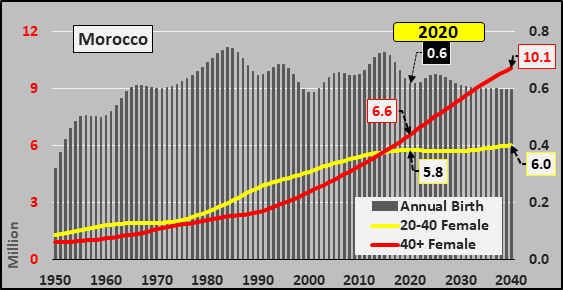
Annual Change; Working-age population, Post working-age population, Discount Rate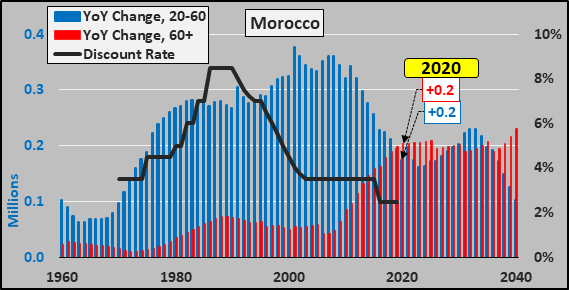
Angola: $95 billion GDP, 33 million persons (0.4%) consume 0.06% global energy.
Total energy consumption (blue line), year over year consumption change (red column).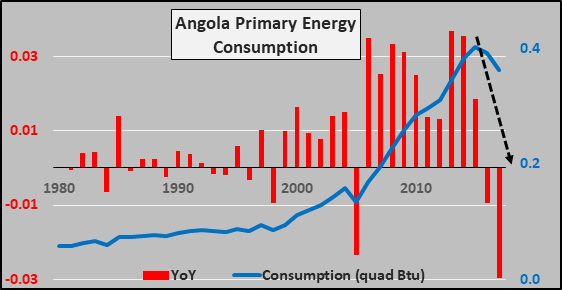
Annual Births, Childbearing, Post Childbearing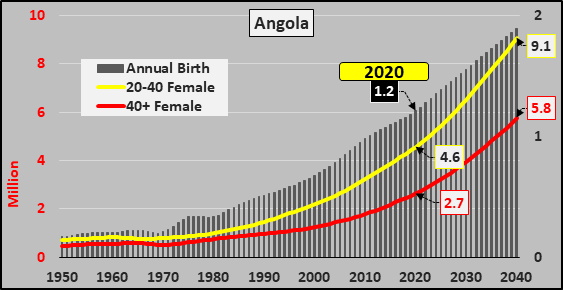
Annual Change; Working-age population, Post working-age population, Discount Rate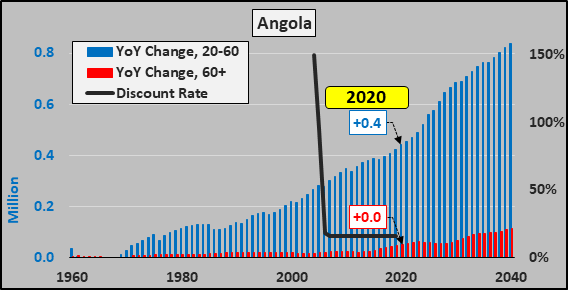
Ghana: $70 billion GDP, 31 million persons (0.4%) consume 0.045% global energy.
Total energy consumption (blue line), year over year consumption change (red column).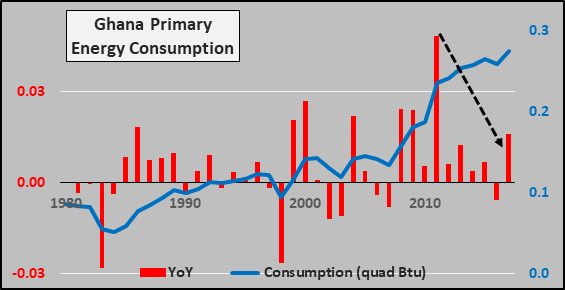
Annual Births, Childbearing, Post Childbearing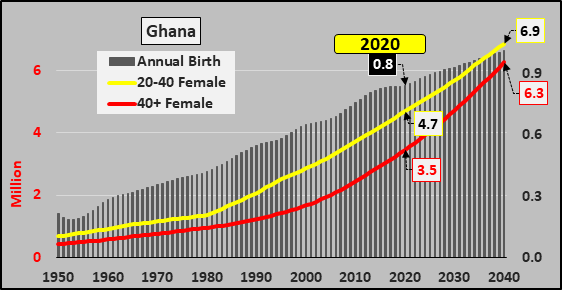
Annual Change; Working-age population, Post working-age population, Discount Rate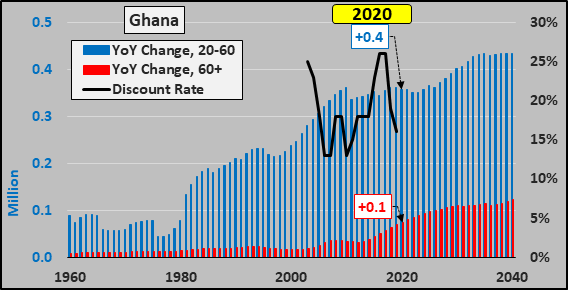
Libya: $50 billion GDP, 7 million persons (0.09%) consume 0.1% global energy.
Total energy consumption (blue line), year over year consumption change (red column).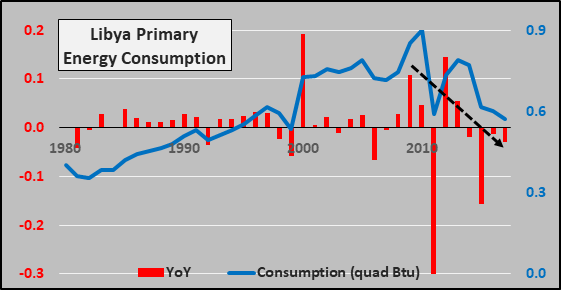
Annual Births, Childbearing, Post Childbearing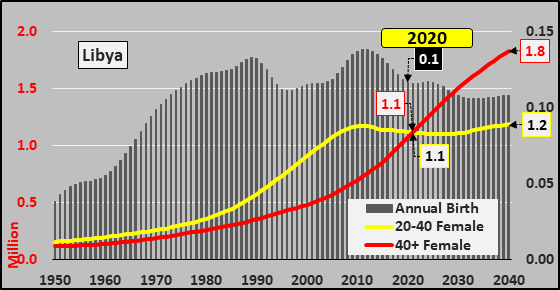
Annual Change; Working-age population, Post working-age population, Discount Rate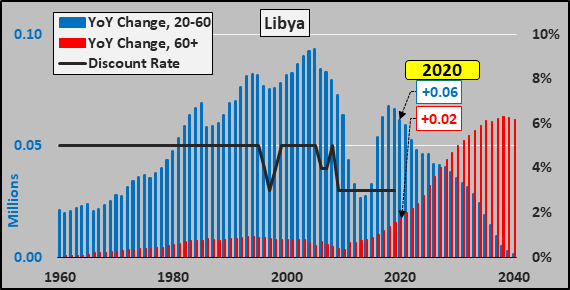
Kenya: $110 billion GDP, 54 million persons (0.7%) consume 0.06% global energy.
Total energy consumption (blue line), year over year consumption change (red column).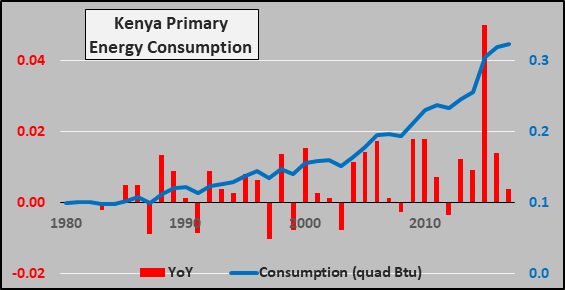
Annual Births, Childbearing, Post Childbearing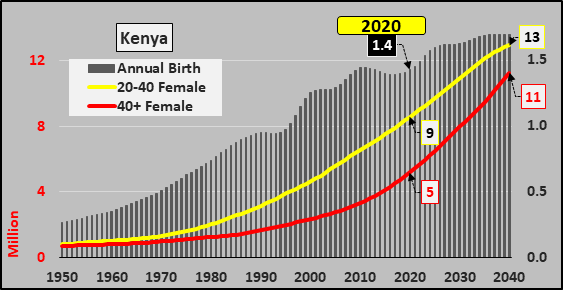
Ethiopia: $100 billion GDP, 115 million persons (1.5%) consume 0.06% global energy.
Total energy consumption (blue line), year over year consumption change (red column).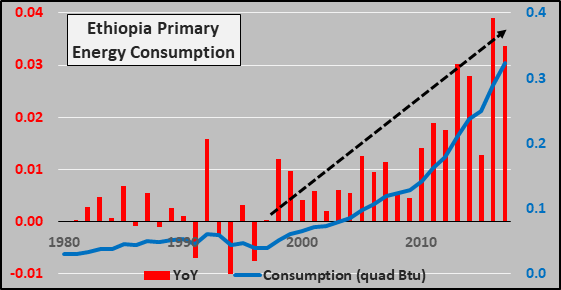
Annual Births, Childbearing, Post Childbearing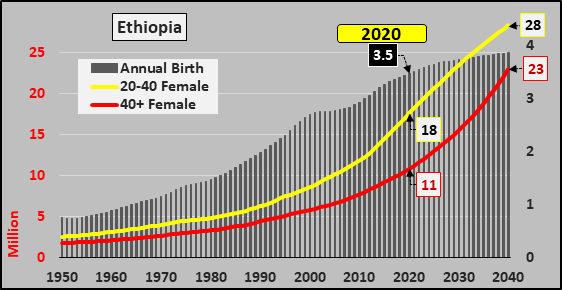
Tanzania: $65 billion GDP, 60 million persons (0.8%) consume 0.05% global energy.
Total energy consumption (blue line), year over year consumption change (red column).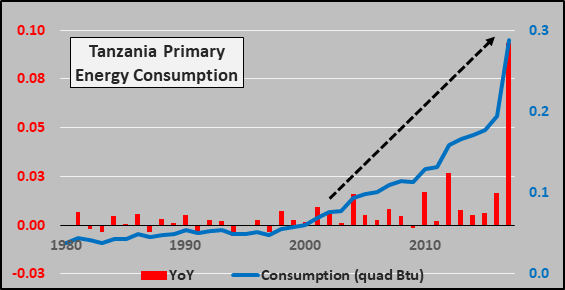
Annual Births, Childbearing, Post Childbearing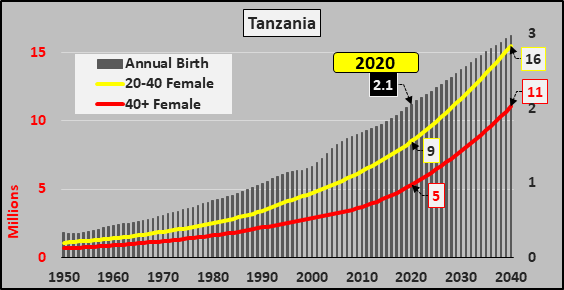
xxx