by UPFINA
Before we get into the latest on earnings estimates, jobless claims, and consumer confidence, let’s quickly recognize how unprecedented the period in markets we have just witnessed has been. As the chart below shows, in the past 7 weeks, there have been 22 days with more than 3% moves either up or down. That’s a record high. In the following periods after record highs, which were October 1932 and November 2008, stocks rose 40% and 27% in the next year.
Volatility records being SHATTERED: 22 days in the past 7 weeks have seen the S&P move more than +/- 3%
The previous records were in Oct 1932 and Nov 2008. In those 2 cases, the S&P staged *epic* rallies of +40% and +27% over the next year pic.twitter.com/LU3QgVAinj
— SentimenTrader (@sentimentrader) April 9, 2020
The current rally has been bigger than any of the bear market rallies in the prior 2 bear markets (early 2000s & late 2000s). Keep in mind, these stats are meaningless in relation to the news flow. If the shutdowns last longer than expected, people aren’t going to stop selling stocks just because there was heightened volatility in March or because this would be a relatively large bear market rally. These are just contextualizing data points.
Earnings Estimates Fall Further
It’s bullish when earnings estimates are too low. That will mean the models have more than fully adjusted for the shutdowns. We aren’t close to there yet in terms of the numbers. We might be close to there in terms of time because of how quickly estimates have fallen.
As you can see from the table below, Q2 growth estimates have fallen from -10.25% on April 1st to -17.54% on April 10th. The estimates usually fall the quickest during earnings season which means the rest of April will likely see Q2 estimates drop significantly. Based on some top down estimates, many firms are leaning in the negative direction. That’s like how policymakers are trying to lean towards doing too much rather than too little. Normally, you wouldn’t want to buy stocks before estimates are done falling, but speculators front ran the recovery starting in late March. This has been a quick recovery in stocks so far.
Here are the updated $SPY EPS growth ests. The 2Q20 period now calls for -17.54% EPS growth & that est is going much lower in the weeks ahead. pic.twitter.com/BD7PqmX95L
— The Earnings Scout (@EarningsScout) April 10, 2020
The chart below shows in a typical year, we would have had $168.98 in EPS based on where estimates started.
2020 consensus estimates continue to trend downward, but are still well above the recession average baseline. More to come. pic.twitter.com/falfe9MhHC
— Strategas (@StrategasRP) April 9, 2020
This year could have been better than average as the economy was tracking towards a rebound, but that’s over now. The current estimate is for $152.43, but that’s only about halfway done falling. Strategas sees $139 in EPS. If this tracks the past 2 recessions, there will be $118.87 in EPS. This recession is different because the rate of the decline in the consensus estimate is much more severe.
Jobless Claims Peaked Already?
It’s possible initial jobless claims have peaked already. Google searches for “file for unemployment” have fallen. TWC data shows claims have fallen in Texas. The potential peak in national claims is just 3 weeks into the spike. That would line up well with the bottom in stocks since claims peak a few weeks after stocks trough. In the week of March 28th, claims were revised up from 6.648 million to 6.867. That revision is larger than the number of claims prior to this recession. We are dealing with very large numbers.
looks like it. Here is Texas (a late lockdown state) pic.twitter.com/Bd95ZNyVc7
— Sam🔔 (@sam_a_bell) April 13, 2020
In the week of April 4th, claims fell to 6.606 million which was above estimates for 5 million, but below the highest estimate of 7.95 million. That’s 16.79 million unemployed people in just 3 weeks. Peak to trough of the last cycle, there was a 8.58 million drop in employed people. We’ve had nearly double the claims as that drop. At a pace of 6.61 million claims per week, the entire labor force would be on unemployment in just 23.6 weeks. That’s why the spike in initial claims is unsustainable. This is already the worst employment market since the Great Depression even if the economy opens tomorrow.
Because the spike in initial claims will end soon, since it can’t keep going at this rate without all the jobs being gone, we must shift our attention to continuing claims. In the week of March 28th, there were 7.455 million claims. That’s already higher than any point since 1987 and that’s delayed 1 week. We know it will rise much higher next week because initial claims spiked. Continuing claims will tell us how quickly the burst in unemployed people is being worked through (meaning if the people are getting jobs again).
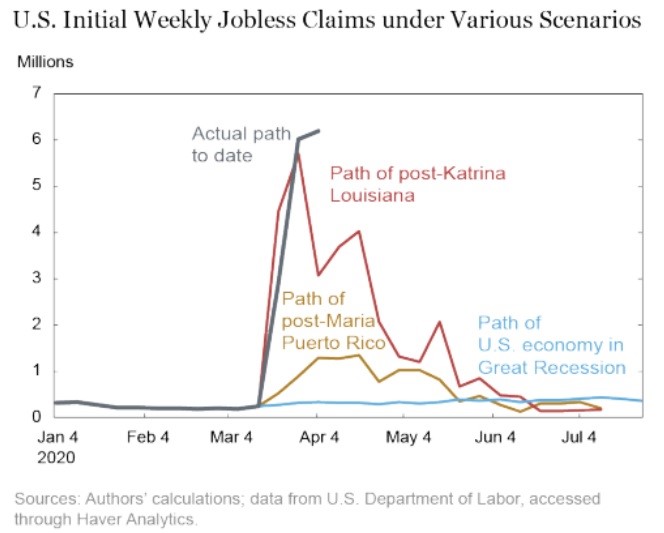
National Hurricane Katrina
The best description of this spike in jobless claims is it is a hurricane Katrina, but for the entire economy instead of one state. The chart below shows the path of jobless claims after hurricane Katrina in Louisiana and after hurricane Maria in Puerto Rico. Those 2 events were scaled up to a national level. Even still, the current actual data is worse than those scaled up events. Cumulatively, the scaled-up version of hurricane Katrina brought 27 million claims. There have been 16.79 million claims in the past 3 weeks.
Big Drop In Consumer Sentiment
The preliminary April consumer sentiment index dropped 18.1 points to 71 which was the largest monthly drop ever. There was a 30 point drop in 2 months which is 50% larger than the largest 2 month drop ever. The current economic conditions index dropped 31.3 points to 72.4 which was almost double the largest drop ever which was 16.6 points in October 2008. The expectations index only fell 9.7 points to 70 which isn’t close to the largest ever decline which was 16.5 points in December 1980.
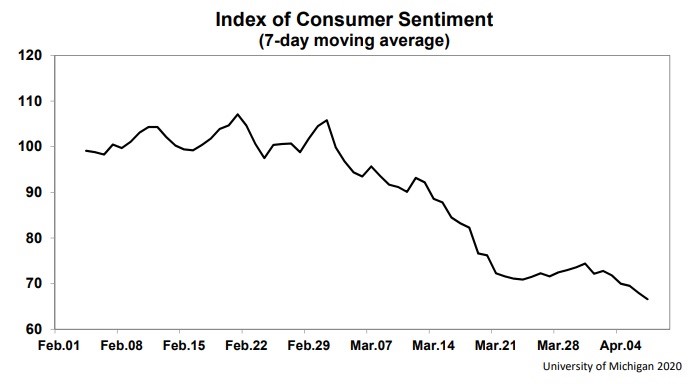
The good news is the latest data suggests the final April reading might not be much worse than the preliminary reading. The chart above shows the 7 day average is in the high 60s. After the final March report, we knew the April report would be a disaster based on the data at the end of the month. The other good news is stocks have rallied. Stocks generally lead consumer confidence.
Conclusion
The volatility in March was record breaking. EPS estimates need to come down further. Jobless claims are so high that at this rate in 23.6 weeks literally everyone would be unemployed. That’s not happening which is why we could have already seen a peak in initial claims. Watch continuing claims to see if people are starting to get their jobs back. Obviously, we are still a few weeks away from that occurring as the economy is still shut down. This was like a national hurricane Katrina except slightly worse. Consumer sentiment crashed the most ever. It had almost an entire cycle’s worth of a decline in just 2 months. The good news is it might not have much room to fall further.