by Dana Lyons

Nasdaq New Highs are at a cycle low and New Lows are at a cycle high; what is this odd set of circumstances telling us?
It has certainly been a monumental weak in the stock market. Moves in both stock prices as well as market-based indicators have been interesting and, in some cases, historic. Take, for example, our Chart Of The Day yesterday.
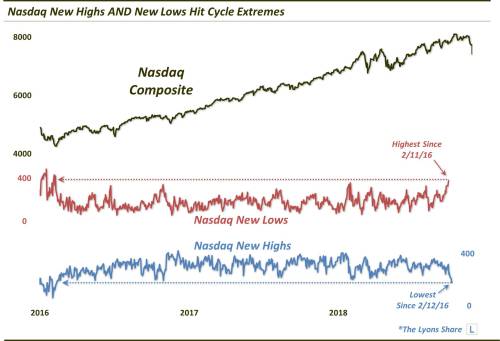
Now, given the recent market action, it’s not at all surprising that the number of New 52-Week Lows are elevated currently, nor that the number of New 52-Week Highs are very low. However, per our data provider, the number of New Lows on the Nasdaq exchange reached a cycle high yesterday of 400. That was the highest number since the market low on February 11, 2016. Again, it’s not surprising to see the number elevated. However, it’s a bit surprising to see it hit a cycle high with the indices not far below all-time highs here.
On the other end of the spectrum, Nasdaq New Lows hit just 13 yesterday. That’s not surprising either. However, that is also a cycle extreme, i.e., the lowest also since the market bottom on February 12, 2016. Again, it’s not surprising to see the direction they’re headed in – but to see both at cycle extremes is really interesting.
Now, we were curious to see if there were other instances of the 2 series at opposite extremes. As it turns out, there have been a handful of other (interesting) occasions, which we examine in a Premium Post at The Lyons Share.
The high New Lows and low New Highs obviously results in an extreme in the number of net New Lows (i.e., New Lows – New Highs). Yesterday’s Net New Lows represented 12% of all issues, as we see in the chart below.
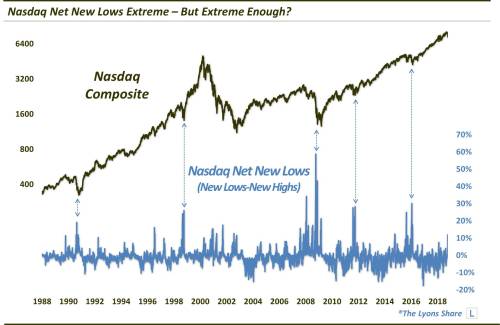
Now, certainly a lot of 52-week lows and a dearth of 52-week highs is not ideal for a stock market bull. However, as the chart demonstrates, there does come a time when the data is so bad that it is good. Or, in other words, it can’t get much worse. However, are we at that point yet? The Net New Lows are certainly well below the highest levels highlighted on the chart. Furthermore, the market is not that far off of its highs. Does that make a difference in how we should interpret this data? We take a closer look at that as well in our Premium Post at TLS.
One thing is for sure – these breadth readings are certainly unusual.