by Dana Lyons

A new take on the issue of diverging transportation stocks – red flag or red herring?
After breaking out to all-time highs following last fall’s presidential election, transportation stocks spent the first half of 2017 consolidating that move. Finally, last month, the Dow Jones Transportation Average (DJT) managed to break out to new highs, a move we heralded at the time. Well, the sector proceeded to do an immediate about face, dropping over the past 3 weeks to test the level of its former highs.
The failed (for now) breakout has many market observers concerned, particularly given the Dow Jones Industrial Average’s (DJIA) inexorable run of new all-time highs. Of course, those 2 averages are the subjects of the infamous “Dow Theory”. One of the premises behind the Dow Theory, in general terms, is that if a new high in one index is not confirmed by the other index, it is a warning sign. That is one reason folks are focused on this recent divergence.
In past studies, we have found that notion to be somewhat overrated, if just for the unreliability of the signals. Some of the divergences certainly have been timely in their warnings. There have just been a lot of them.
In today’s Chart Of The Day, we take a unique look at these divergences, in an attempt to whittle down the number of occurrences and perhaps find a helpful new signal. Specifically, we look at times when the DJIA was at a 52-week high, yet the DJT was more than 5% below its own 52-week high. One further caveat is that the DJT hit a 52-week high at some point in the past 3 months.
That criteria yielded 18 unique occurrences going back to 1900, including our present case.
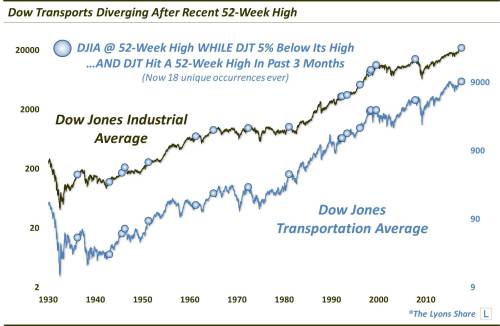
Our thinking when including the criteria that the DJT must have recently hit a 52-week high was that it perhaps dampened some of the negativity resulting following such divergences. Looking at some of the inauspiciously timed signals on the chart, we’re not sure that was the correct thesis.
In a premium post at The Lyons Share, we dive deeper into the prior events, and the subsequent performance of both the Dow Industrials and the Transports. This quantitatively-backed effort helps to address the question of whether this divergence is a red flag or a red herring.