Wolf Richter wolfstreet.com, www.amazon.com/author/wolfrichter
A six-quarter surge, with first signs that some of it has started to unwind.
The inventory pileup I have been discussing for a while played a big role in the surprisingly strong 3.2% GDP growth reported on Friday, but it also played a big role in 2018. And it played a big role in 2014 and early 2015 before it got wound down, as inventory pileups always do, in a series of events that triggered the “transportation recession” of 2015 and 2016 (here is a taste from May 2016: “Freight Rail Traffic Plunges: Haunting Pictures of Transportation Recession: 292 Union Pacific engines idled in Arizona Desert”). As a consequence, the overall economy in 2016, still propped up by growth in services, grew at merely 1.6%, the stingiest growth since the Great Recession.
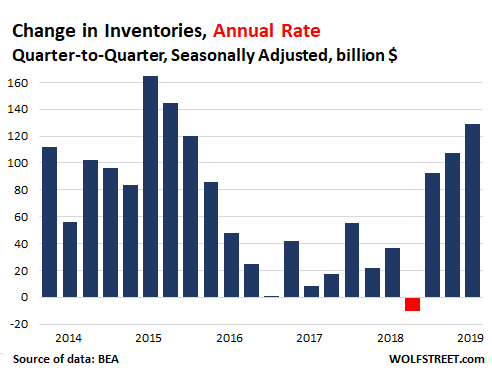
The Bureau of Economic Analysis reported that private inventories in Q1 grew at an annual rate of $129 billion from Q4 last year, seasonally adjusted. “Annual rate” means that if inventories keep growing at this rate, the total increase for the whole year would be $129 billion. But it wasn’t as big as Q1 and Q2 2015.
Increases in inventories are considered an investment and are added to GDP as such; conversely, decreases in inventories are subtracted from GDP.
This increase in inventories in Q1 2019, adjusted for inflation, added +0.65 percentage points to GDP, according to the BEA. Without this increase in inventories – so with flat inventories from Q4 to Q1 – the 3.2% GDP growth would have been 2.55%.
In 2018, changes in inventories impacted GDP growth this way:
- Q4 2018: +0.11 percentage points
- Q3 2018: +2.33 percentage points
- Q2 2018: -1.17 percentage points
- Q1 2018: +0.27 percentage points
The chart below shows the quarter-to-quarter increase or decrease in inventories expressed as an annual rate:
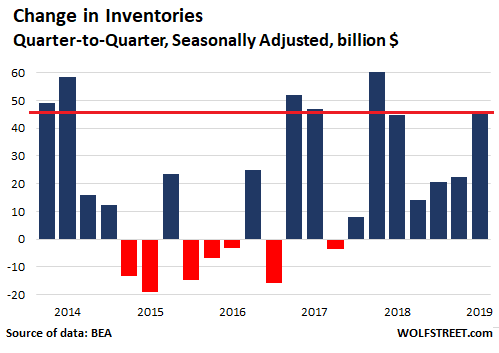
In terms of actual increase in inventories, not an annual rate: Inventories rose by $46.3 billion in Q1 from the prior quarter, seasonally adjusted. The chart below shows the quarter-to-quarter changes. The jump in Q1 2019 was just a tad larger than in Q1 2018 ($44.8 billion) and was smaller than in Q4 2017, Q4 2016, Q2 2014, and Q1 2014:
In terms of total private inventories, they hit a record of $2.83 trillion (seasonally adjusted) in Q1. At the business level, inventories are valued at cost, and the final sales amount of those $2.83 trillion in inventory will be a lot higher. In other words, there’s a lot of stuff in inventory.
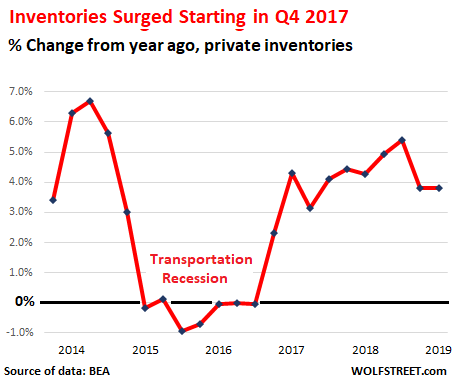
The inventory level of $2.83 trillion was up 3.8% year-over-year, matching the year-over-year increase in Q4. But those two were the lowest year-over-year increases since Q2 2017. But when businesses whittle down their inventories by ordering less, it ripples through the economy, lowers GDP growth – and in 2015 and 2016 triggered the “transportation recession”:
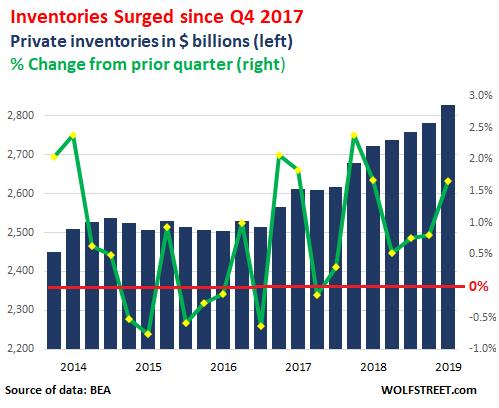
On a quarter-to-quarter bases, in Q1 2019, inventories grew 1.7% from the prior quarter, same as in Q1 2018, but lower than the 2.4% jump in Q4 2017. This inventory pileup has been going on essentially for six quarters, over which inventories have ballooned by $210 billion, or by 8%.
The chart below shows total private inventories in billion dollars (blue columns, left scale) and the quarter-to-quarter percentage change (green line, right scale), seasonally adjusted:
The largest categories in the $2.83 trillion in total private inventories are manufacturers, wholesalers, retailers, and farms.
Farm inventories have been on a relentless down trend since their peak in 2014, dropping 26% (not adjusted for inflation) from $237 billion in 2014 to $173 billion in Q1 2019, according to the BEA.
Inventories at manufacturers rose 3.6% year-over-year in February to a record $692 billion (not seasonally adjusted), according to the latest data available from the Commerce Department. But from mid-2014 through December 2016, manufacturers had trimmed their inventories, hitting a low point of $615 billion in December 2016. This whittling down of inventories had contributed to the miserably slow growth of GDP in 2016 of 1.6% and to the “transportation recession.”
Inventories at retailers, including auto dealers, rose 4.3% year-over-year in February (latest data available from the Commerce Department) to $661 billion.
These inventories at retailers include $249 billion in inventories at new- and used-vehicle dealers and at auto-parts dealers, whose inventories inched up by $1.8 billion in February, and by $5.5 billion in January (the most recent data available), after having fallen in December by $7.3 billion. This data is not adjusted for price changes.
Based on consumer demand, automakers have been switching to more expensive pickups, SUVs, and crossovers (“trucks”), whose sales have surged by 38% from 2014, and away from cars, whose sales have collapsed by 30% over the same period. Hence, the composition of those inventories at dealers has also changed in favor of those more expensive “trucks,” and the value in dollars of those inventories has risen in part because of this shift.
Since this shift from cars to “trucks” took off with a vengeance (a shift that I’ve long called “Carmageddon”) in late 2014, the total value of auto inventories has surged by 42%! So a part of this increase in value of those inventories is structural and is unlikely to reverse.
Inventories at merchant wholesalers soared 6.9% year-over-year to $669 billion in February.
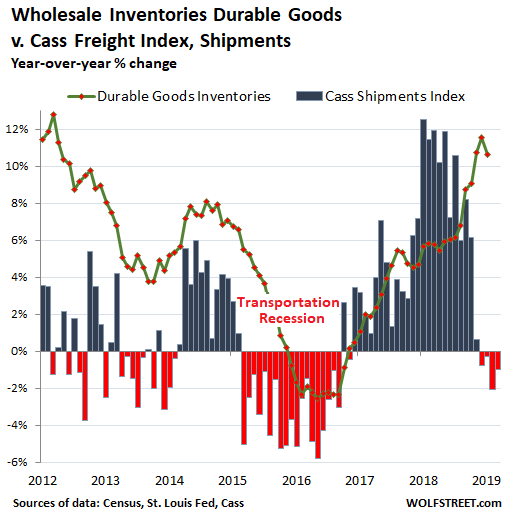
Within this group, wholesale inventories of durable goods, in February at $415.6 billion, started surging in mid-2018 and reached double-digit year-over-year growth rates in December (+10.7%), January (+11.6%), and February (+10.6%). But February, on a month-to-month basis, already marked a slight down-tick from January, a first sign that businesses have started efforts to whittle down their inventories.
Now a similar pattern is forming as we had seen before and during the last transportation recession in 2015 and 2016: Durable goods inventories have been piling up at wholesalers since late 2017, while shipment volume of goods, as tracked by the Cass Freight Index, after a historic boom in 2018, have now declined four months in a row.
The chart below shows the Cass Freight Index for Shipments (columns) and wholesale inventories of durable goods (green line), both expressed as percent change from the same month a year earlier. Inventories follow shipments with a lag:
So where is this going?
On the retail side, there is some seasonality in auto inventories, but this data is also seasonally adjusted. Overall, the structural shift to more expensive new-vehicle types (“trucks”) will continue to do its magic until that shift has run it course. Given some quarter-to-quarter seasonal fluctuations, I expect the value of vehicle inventories to rise overall in 2019 and act as a boost to GDP.
But the likely process of whittling down inventories at wholesalers and manufacturers will act as a drag on GDP, with the first signs cropping up perhaps as early as the second quarter and spreading into next year. How much of a drag will depend on how rapidly inventories are being whittled down. For now, the signs do not point at a massive panic-style culling of inventories, but rather a careful and slow process that does not impact GDP in a dramatic fashion.