Chuck Prince famously said we have to dance until the music stops. Actually the music had stopped already when he said that.
– George Soros
In recent days, the combination of extreme valuations and unfavorable market internals has been joined by acute dispersion in daily trading data that often occurs within a few days of pre-collapse peaks in the market. My opinion is that the music has already quietly faded out like the end of a pop song, in a wholly uneventful way, and that even a surprise push to further highs would be marginal. Still, as a practical matter, there’s no need for opinions or forecasts about future market behavior – it’s enough to align ourselves with prevailing conditions, and to change our stance as observable conditions change.
Be careful to distinguish the level of valuations, which have been extreme for quite some time, from the consequences of overvaluation, which depend on surrounding market conditions. While valuations provide an enormous amount of information about long-term investment prospects, and likely downside risk over the completion of any cycle, the information from valuations is often entirely useless and even detrimental over shorter segments of the market cycle. The question isn’t whether valuations are useful, but when.
What governs market behavior over shorter segments of the cycle is the psychological disposition of investors toward speculation or risk-aversion, which we infer from the behavior of market internals across thousands of individual securities, as well as sectors, industries, and security-types. When investors are inclined to speculate, they tend to be indiscriminate about it. But once the “uniformity” of market internals deteriorates, and market action displays increasing dispersion, divergence, and lack of participation, it’s a rather strong signal that speculation has left the building.
When the market loses that uniformity, valuations often matter suddenly, and with a vengeance. This is a lesson best learned before a crash rather than after one.
– John P. Hussman, Ph.D., October 3, 2000
Presently, the dispersion we observe in market internals suggests that investors are becoming increasingly selective; that their psychology has subtly shifted away from speculation, and toward risk-aversion. Our own measures shifted negative on February 2, 2018. More recently, the 2% advance of the S&P 500 Index beyond its late-January high has been accompanied by a sharp narrowing of participation and leadership across individual securities. The profound narrowing we observe in daily data, coupled with repeated leadership reversals within a fraction of a percent of the recent market highs, is what amplifies the likelihood that recent valuation extremes will have immediate and severe consequences, as they did after the 2000 and 2007 peaks.
I’ve noted over the years that substantial market declines are often preceded by a combination of internal dispersion, where the market simultaneously registers a relatively large number of new highs and new lows among individual stocks, and a leadership reversal, where the statistics shift from a majority of new highs to a majority of new lows within a small number of trading sessions.
– John P. Hussman, Ph.D, July 30, 2007
Among the features we observe at a daily resolution, the advance to the most recent record high on Thursday, September 20 was accompanied by a string of trading sessions with elevated totals of both new 52-week highs and new lows on the NYSE, followed by an immediate leadership reversal where the number of new lows soared above the number of new highs, despite the fact that the S&P 500 was still within a fraction of a percent of its record. Similarly, participation has been ragged, with over 40% of NYSE issues already below their respective 200-day moving averages even as the S&P 500 has pushed higher. We observed a similar combination of internal divergences, leadership reversal, and ragged participation immediately surrounding the 2007, 2000, 1987 and 1973 market peaks. The music is fading out, and a trap-door has opened up in the floor, but they’re still dancing.
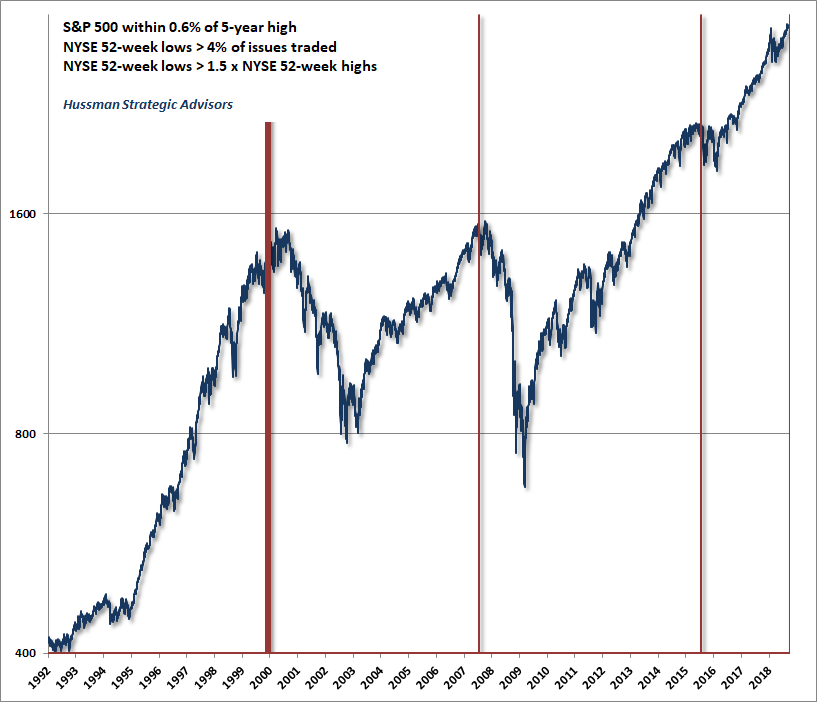
Without making too much of daily data, the following chart shows how unusual is to see large leadership reversals as the market is setting new highs. The chart shows every instance in the past 25 years when the S&P 500 was within 0.6% of a 5-year high, yet the number of NYSE 52-week lows exceeded 4% of issues traded, and stood at least 50% above the corresponding number of new highs.
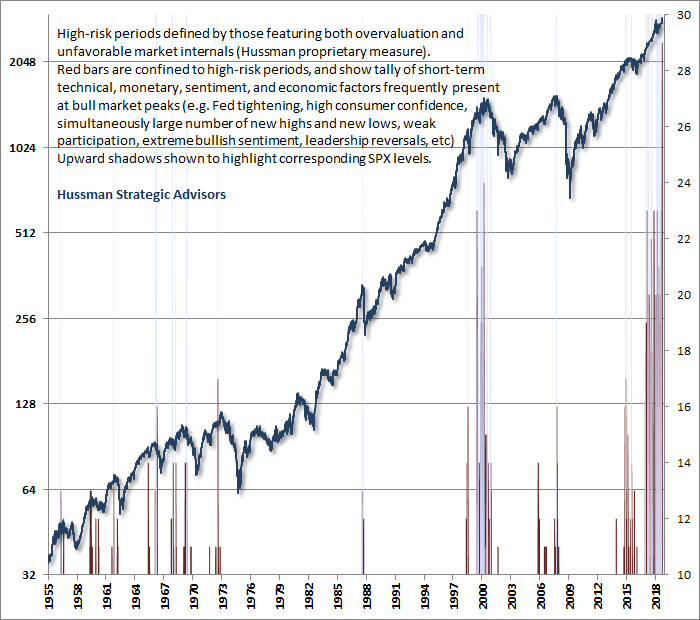
The chart below shows a tally of an even broader set of technical, monetary, sentiment, and economic features frequently observed at bull market peaks, where the bars are restricted to periods with both overvaluation and unfavorable market internals on our measures. The only time we’ve ever seen a confluence of risk factors anywhere close to those of today was the week of March 24, 2000, which marked the peak of the technology bubble. In my view, this sort of analysis is useful because it doesn’t rely on any single risk factor, and emphasizes that while these risk factors can emerge individually without consequence, a large and critical mass of them probably shouldn’t be dismissed. My impression is that this is as close as one gets to ringing a bell at the top.
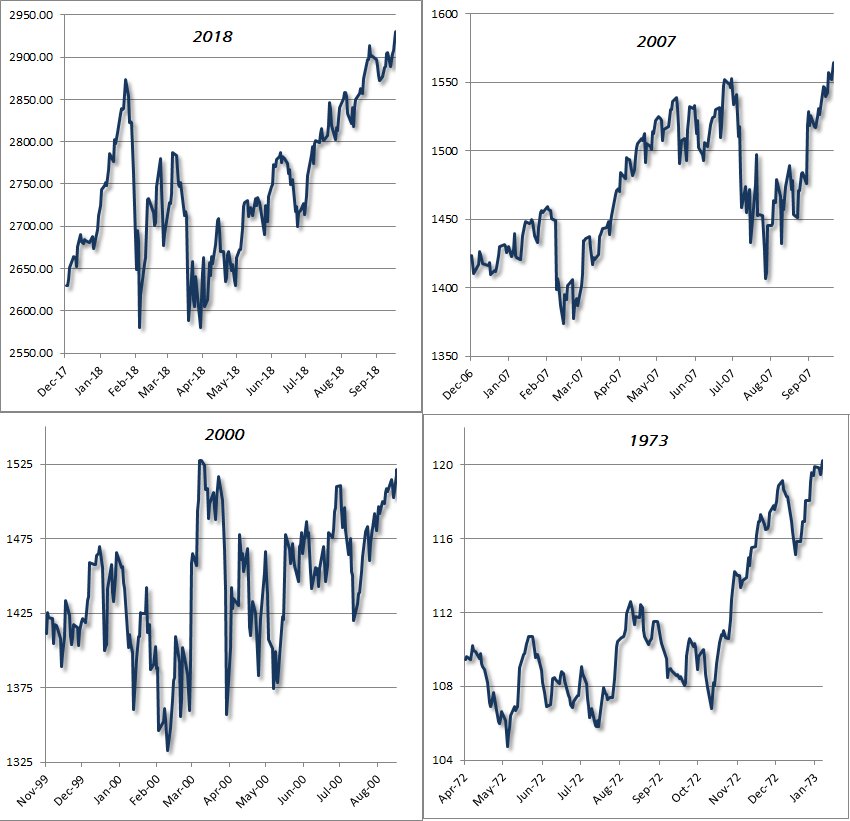
There’s a perception that bull markets have to go out with fireworks, like a spectacular finale of light and explosion that tells everyone in the most obvious way possible that the show is over, followed by the sound of parents everywhere calling to their children “Get in the van! Get in the van!” in order to beat the crowd. But that’s really only true of “V” tops like 1929 and 1987, where the market advanced by over 30% from correction lows to the final bull market highs. More generally, the final months of a bull market tend to be much choppier events. To the extent that they include a “speculative blowoff,” the excitement is typically restricted to an increasingly narrow handful of stocks, with divergent leadership and ragged participation more broadly. That, of course, is exactly the type of market action we see at present.
The chart below shows the final 200 days leading to the bull market tops of 1973, 2000 (the final high on a total return basis was 9/1/2000), and 2007. Each peak was followed by market losses approaching -50% or more. The advance to the most recent September 20 high is shown for comparison. In each case, price fluctuations in those last 200 days spanned about 15% from low to high, and featured separated retests of the final highs. Our present concerns are based on valuations, market internals, and other factors, but it should be clear that no further “blowoff” is required in order for the recent bull market to establish its peak.
Obvious in hindsight
Decades ago, a legendary trader told me “Kid, everything looks easy once you know how it works.” Every field of human endeavor is full of examples where people struggled to solve a problem, yet having done so, the solution looked almost embarassingly obvious in hindsight.
Our struggle the advancing part of this market cycle had that same character. In previous market cycles, there was always a limit to speculation. Once conditions got sufficiently extreme, you could expect steep market losses, even before market internals actually deteriorated. Based on decades of historical evidence, the methods that came out of our 2009-2010 stress-testing against Depression-era data actually strengthened our bearish response to those extremes.
That single aspect of our methods, combined with Ben Bernanke’s deranged monetary experiment with quantitative easing, unleashed a perfect storm, and investment outcomes that were nothing like our admirable experience in previous complete market cycles.
As investors became convinced that zero interest rates gave them no alternative but to speculate, it became utterly detrimental take a pre-emptive bearish stance in response to “overvalued, overbought, overbullish” extremes, as one could have done in previous market cycles. The solution to this problem seems obvious in hindsight, but reaching it was painfully incremental because a century of evidence encouraged an immediate bearish response to those extremes.
Put simply, in late-2017, we abandoned the idea that there is any definable “limit” to speculative recklessness of Wall Street, as there was in prior market cycles. We now require explicit deterioration in market internals in order to adopt a bearish market outlook, with no exceptions. We can hold a neutral outlook given sufficiently extreme conditions, but whenever uniformly favorable market internals indicate that the speculative bit is back in their teeth, our willingness to adopt or amplify a negative market outlook drops to zero. Most often, when our measures of market internals are uniformly favorable, our market outlook will be constructive as well.
It’s a profound mistake to imagine that valuations or market internals have become less effective in navigating market cycles. There’s no evidence to that effect.
The fact is that valuations and market internals, in combination, navigated the recent market cycle beautifully, as they have in prior market cycles. Indeed, the entire net gain in the S&P 500 in the complete cycle from the 2007 peak to the present has occurred in periods where our measures of market internals were favorable. In contrast, nearly all of the 2007-2009 market collapse occurred in periods when those measures were unfavorable.
Likewise, our measures of valuation correctly identified extremes in 2007 and today, and identified the market as undervalued in late-2008 and 2009, which I observed in real-time. It’s a profound mistake to imagine that valuations or market internals have become less effective in navigating market cycles. There’s no evidence to that effect.
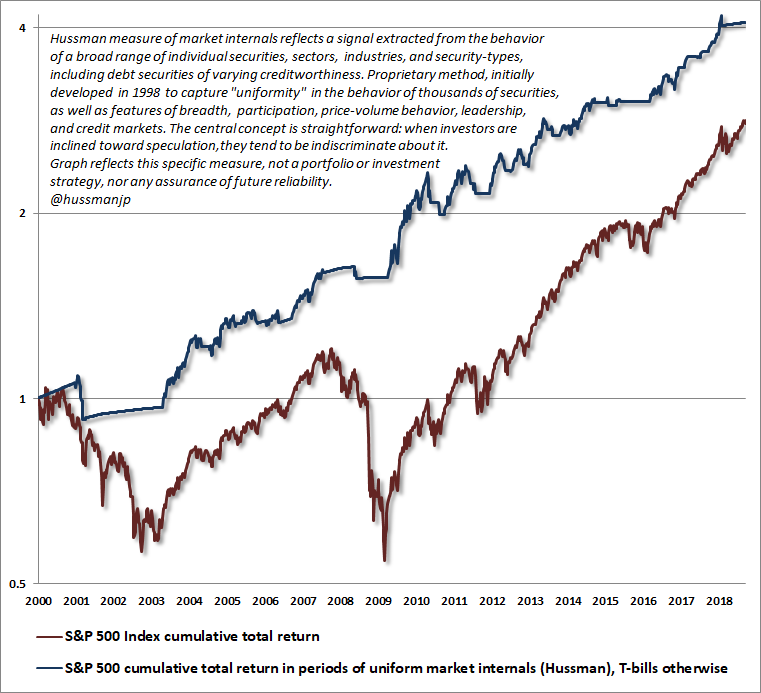
The chart below shows the cumulative total return of the S&P 500 since 2000, alongside the cumulative total return of the S&P 500 restricted to periods when our measures of market internals were favorable (accruing Treasury-bill interest when internals were unfavorable). Though the period from 2000 to 2009 may look somewhat familiar to long-time followers of my work, the chart does not reflect any portfolio or investment strategy, nor any assurance of future reliability – only the primary measure of market internals that we’ve developed to support our classification of market conditions.
A $20 trillion loss in market capitalization
On the subject of Federal Reserve policy, the current back-slapping about the success of extraordinary monetary policy is a lot like declaring victory in a football game at halftime, just before a flock of fire-breathing dragons swoops onto the field and eats the leading team. As we saw in the collapse of the mortgage bubble (another product of yield-seeking speculation brought to you by your friends at the Federal Reserve), we have to allow for the possibility that the second half of the game will be violently unrecognizable.
I describe recent Fed policies with the word “deranged” intentionally – not just because those policies took interest rates and the monetary base far outside of their historical range, but also because doing so has encouraged an even more grotesque round of yield-seeking speculation than the preceding mortgage bubble, which ended in global financial collapse. In the interest of protecting the jobs of bank executives, and protecting bank bondholders from perhaps a few hundred billion dollars in losses (depositors were never at risk, which should be immediately obvious from studying any bank balance sheet), the Fed created yet another yield-seeking bubble that has encouraged vastly expanded indebtedness in every sector of the economy, and has set U.S. equity market investors up for a likely loss in excess of $20 trillion in market capitalization in the coming years.
A $20 trillion market loss? Preposterous. The audacity – nay – the temerity, as Gary Gulman would say. Unfortunately, that’s how valuations work over the complete cycle. That’s how it was possible to correctly project an -83% loss in tech stocks in March 2000, and a loss in the S&P 500 of about -50% at the 2007 peak. When you’re pushing $40 trillion in U.S. equity market capitalization, the highest multiple of U.S. GDP in history, a loss of half of that capitalization over the completion of the cycle is a conservative estimate. It’s certainly not a worst-case scenario. Also, remember from the 2000-2002 and 2007-2009 collapses that Fed easing does nothing to provoke speculation in periods where investors are risk-averse, because in a risk-averse environment, safe liquidity is a desirable asset rather than an inferior one.
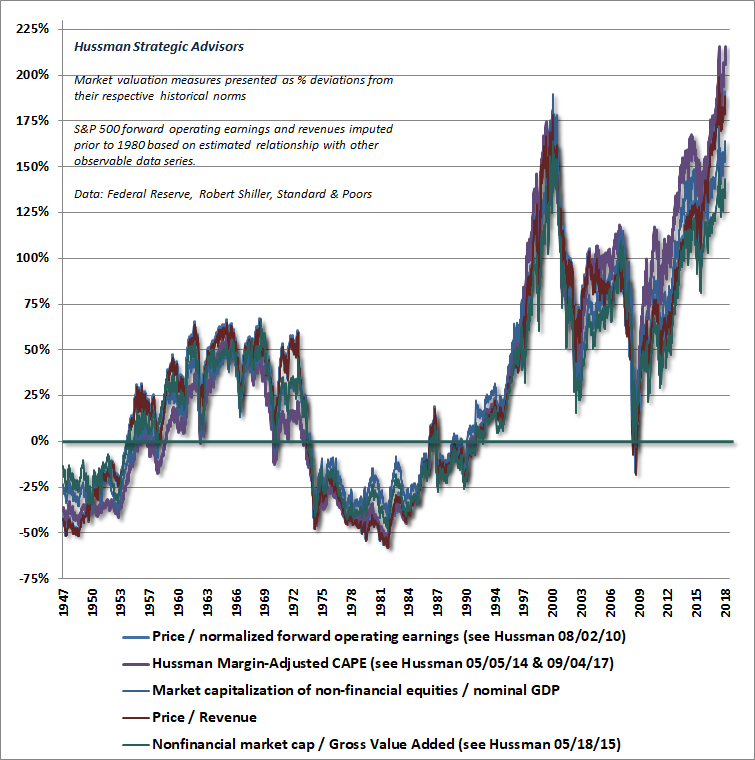
Frankly, wiping out half of U.S. equity market capitalization would not even bring the most reliable measures of market valuation to their historical norms, so that outcome is somewhat less likely than wiping out two-thirds of market capitalization over the completion of this episode. The chart below provides an overview of the most reliable valuation measures we identify, which are presently nearly 200% (three times) their historical norms.
What if the bull market continues?
Despite our emphatic concerns here, we have no attachment to a hard-negative market outlook or investment stance. If our measures of market internals were to improve, indicating that investors had again taken the speculative bit in their teeth, even our own investment outlook would immediately shift neutral or constructive (though with a safety net given current valuations). That’s the central adaptation that was required of our discipline in this cycle: if market internals are favorable, it’s necessary to adopt a neutral or constructive outlook; even in the face of breathtakingly overextended conditions; even in the face of most extreme valuations in U.S. history, on the measures we find best correlated with actual subsequent market returns.
Though my sense is that the market is currently registering a major bull market peak, suppose that the market is actually poised to double from its current level without any material weakness at all. Frankly, that would be fine, because it’s very unlikely for the market to experience a sustained advance without also recruiting favorable market internals, which would encourage us to shift our stance to a much more constructive outlook (though undoubtedly with a safety net given current valuation extremes). It was our pre-emptive bearish response to “overvalued, overbought, overbullish” features of market action – without deterioration in market internals – that created difficulty for us in recent years.
Put simply, in late-2017, we abandoned the idea that there is any definable “limit” to speculative recklessness of Wall Street, as there was in prior market cycles. We now require explicit deterioration in market internals in order to adopt a bearish market outlook, with no exceptions.
Regardless of whether the market is destined to advance or collapse, it’s enough to respond to observable market conditions as they change. No opinions or forecasts are actually required. My main reason for discussing a likely market peak here is that the initial decline of a bear market tends to be rather violent. Once prices have dropped sharply, it becomes extremely difficult for investors to reduce their exposure to risk, even when the prospect of additional severe losses remains very high. Instead, they often ride out the entire bear market collapse and eventually abandon stocks in a final panic. If investors don’t get out at the highs, they end up getting out at the lows.
Fish don’t know they’re in water
A fish swims up to another fish and asks “How’s the water?” The other fish replies, “What the heck is water?”
The problem with financial bubbles is not that they are objectively difficult to recognize, but that they can only emerge if the majority of market participants are willing to excuse or dismiss the extremes. Intuitively, if overvaluation alone was always immediately followed by market losses, it would be impossible for the market to reach valuation extremes like 1929, 2000 and today, because the market advance would have been halted by much lesser overvaluation. Instead, periods of speculation can persist for some time, despite extraordinary valuations. By the peak of every market bubble, investors come to imagine that historically reliable valuation measures are useless and no longer “work,” because they don’t understand how valuations work in the first place. As a consequence, they are repeatedly brutalized by the market collapses that follow.
At market extremes, investors become so impressed by the recent and glorious outcomes of their own speculation that they don’t even recognize the bubble surrounding them. After the bubble collapses, it becomes easier for investors to look back and observe that it was “obvious” in hindsight.
One of the best examples of this was July 2000, when the Wall Street Journal ran an article titled (in the print version) “What were we THINKING?” The article reflected on the “arrogance, greed, and optimism” that had already been followed by the collapse of dot-com stocks. My favorite line: “Now we know better. Why didn’t they see it coming?” Unfortunately, that article was published at a point where the Nasdaq still had an 80% loss (not a typo) ahead of it.
Again, the only way to produce bubbles like 1929, 2000 and today is for speculation to continue despite lesser extremes. That doesn’t mean that valuations have failed. It means that speculation has persisted for longer than usual, and that the devastating consequences of hypervaluation are still ahead. Someone has to remain willing to say that out loud. The financial markets are in a bubble. It will end badly.
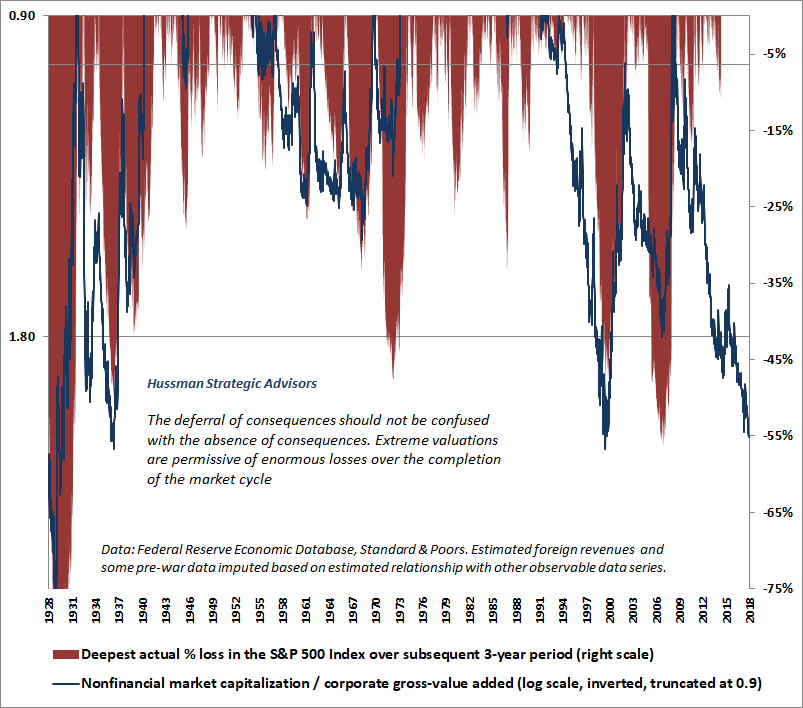
Given current valuations, even a return to average run-of-the-mill historical norms would result in a loss of about two-thirds of U.S. stock market capitalization. Meanwhile, any significant recession will likely be accompanied by a wave of corporate bankruptcies in a system where corporate debt is easily at the highest percentage of corporate gross value-added in history, and the median corporate credit rating is already just one notch above junk.
The likelihood of collapse will be smaller in periods when market internals are uniformly favorable across a very wide range of securities, because indiscriminate behavior is a hallmark of speculation. The likelihood of a collapse will increase dramatically in periods when market internals are weak or divergent, as they are now, because selectivity is a hallmark of growing risk-aversion.
The entire net gain in the S&P 500 in the complete cycle from the 2007 peak to the present has occurred in periods where our measures of market internals were favorable. In contrast, nearly all of the 2007-2009 market collapse occurred in periods when those measures were unfavorable.
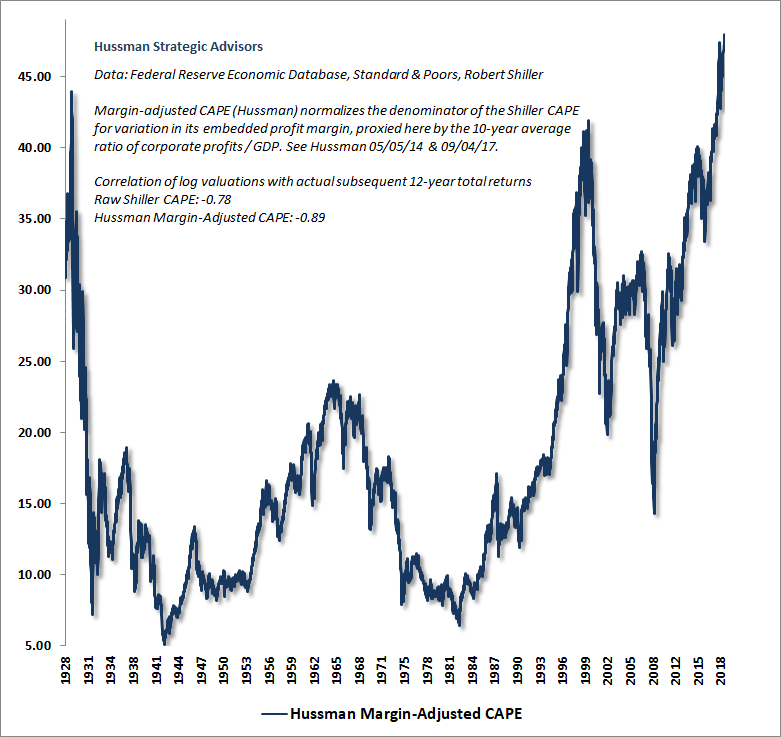
The chart below shows our margin-adjusted CAPE, which now stands beyond even the 1929 and 2000 market peaks.
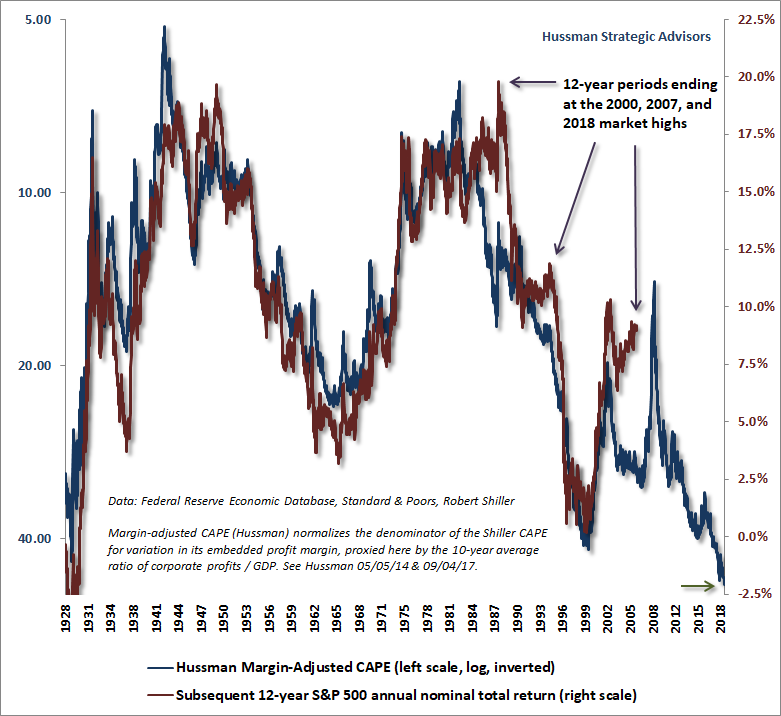
The chart below shows the margin-adjusted CAPE on an inverted log scale, along with the actual subsequent S&P 500 average annual nominal total return over the following 12-year period. As I’ve observed before, the “forecast errors” that periodically emerge at bubble peaks and secular troughs are strongly correlated with the level of consumer confidence at the end of a given 12-year horizon. That’s another way of saying that temporary extremes in valuations are driven by cyclical but impermanent fluctuations in the psychology of market participants between optimism and pessimism.
Expecting the unexpected
The growth rate of real U.S. GDP had just hit a quarterly growth rate of 7.3% annualized, while the unemployment rate dipped to just 4%. Four months later, in October 2000, I noted that our Recession Warning Composite was already indicating the likelihood of an oncoming recession. Stock prices began declining immediately. By the time the recession began in March 2001, ECRI was the only major organization to join that recession warning, and by then, the S&P 500 was down by more than 25%.
In November 2007, our Recession Warning Composite again indicated an oncoming recession. The recession began a month later, though real GDP growth still came in at 2.4% for the fourth quarter of 2007, and unemployment was only slightly above its low of 4.4%. The economy was already 4 months into a recession before Ben Bernanke even conceded that “Recession is possible, but recession is a technical term. I’m not ready to say whether or not the U.S. economy will face such a situation.” It took until June for Martin Feldstein at the NBER to suggest “I think we’re heading for a recession.” By the time an ongoing recession was broadly recognized, the market was in free-fall.
That’s the problem we have with the ridiculous chorus of milquetoast lip-service from Wall Street about the “possibility of a recession in late-2020,” as if even breathing the R-word is a dire, edgy forecast. Somehow, investors and even Wall Street professionals have come to imagine that a quarterly growth rate of 4% (annualized) somehow takes the possibility of a recession off the table for years. When the next recession arrives, they’re not going to know what hit them.
The chart below shows the highest quarterly growth rate and the lowest unemployment rate within two quarters preceding the past 10 recessions. The most recent data is shown for reference, not because I believe a recession is imminent, though as we’ll see, that can change in the blink of an eye. Note that there is absolutely nothing spectacular about a single-quarter real GDP growth rate of 4% (which is actually just 1% growth, times 4 to make it an annual figure). Nothing about it prevents a virtually immediate recession either.
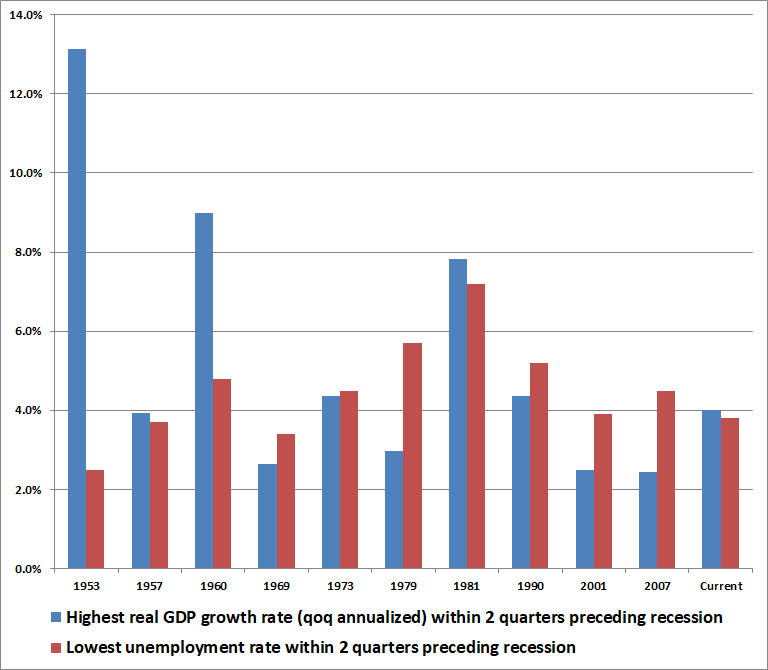
While we presently don’t observe the signs of an oncoming recession, we’re often asked how the market could possibly lose two-thirds of its value without one. The answer is that a recession warning will likely come after market losses are already underway, not before.
To understand how all of this works, and to appreciate how ludicrous it is to suggest that there’s “no recession on the horizon” even looking years ahead, the chart below may be instructive. The chart reflects three key elements of economic optimism: consumer confidence, stock market valuations, and the unemployment rate. Each of these is expressed in terms of standard deviations from their respective averages, so they can be directly compared. The chart shows the average of the three (with unemployment inverted so lower unemployment results in a higher value). The first thing to notice is that the recent expansion is the longest on record, and that valuations, consumer confidence, and employment conditions are clearly near their upper extremes.
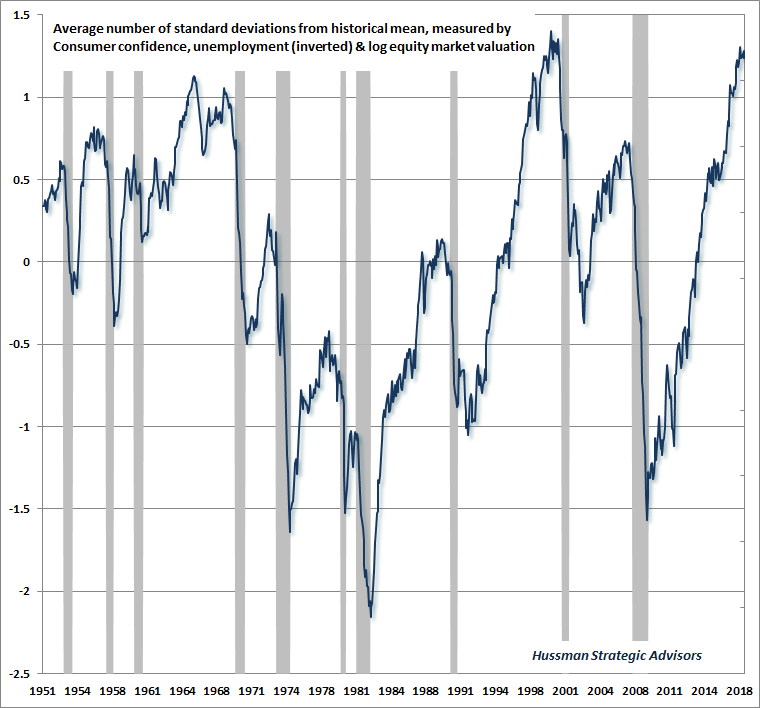
The second thing to notice about the above chart is how breathtakingly narrow the gap is between conditions of extreme economic optimism and the beginning of recessions. There’s no protracted slowing or long warning period. If you’re lucky, you might get a warning from slowly deteriorating consumer confidence, as occurred before the 1980 recession. More often, the gap between extreme optimism and the start of a recession is a few months at best.
When you observe a concerted downturn in a variety of financial and survey-based economic measures, even over a 6-month lookback, the risk of recession has just increased dramatically. The criteria below define a conservative version of our Recession Warning Composite, where “conservative” means that the criteria are a bit stricter than we’ve periodically used in practice, but are also less likely to provide false signals (as we experienced in 2011, for example):
- S&P 500 below its level of 6 months earlier
- ISM Purchasing Managers Index below 50
- Yield curve not steep: 10-year Treasury yield no higher than 2.5% above 90-day T-bill yield
- Credit spreads wider than 6 months earlier, based on either Moody’s Baa yield – the 10-year Treasury yield or Commercial paper yield – 90-day T-bill yield.
- Slowing job growth: Unemployment rate more than 0.3% above its 12-month low, or non-farm payroll growth less than 1.4% year-over-year.
None of these criteria are particularly reliable in themselves. It’s a concerted downturn in all of them that’s informative. Uniformity matters. As in all noise-reduction approaches, there is vastly more information in the common signal drawn from multiple sensors than there is in any single measure by itself. Of course, that’s also the underlying concept behind our measures of market internals, and approaches I’ve developed in other fields over time (including methods for amplifying the information from genetic data in conditions like autism and multiple sclerosis).
The blue bars in the chart below show periods when all of the criteria in our Recession Warning Composite were observed in month-end data. The red bars show actual U.S. recessions. It’s possible to increase the timeliness of the signals, for example, by raising the ISM threshold to 54 and dropping the criteria for credit spreads, but that also increases the risk of false signals.
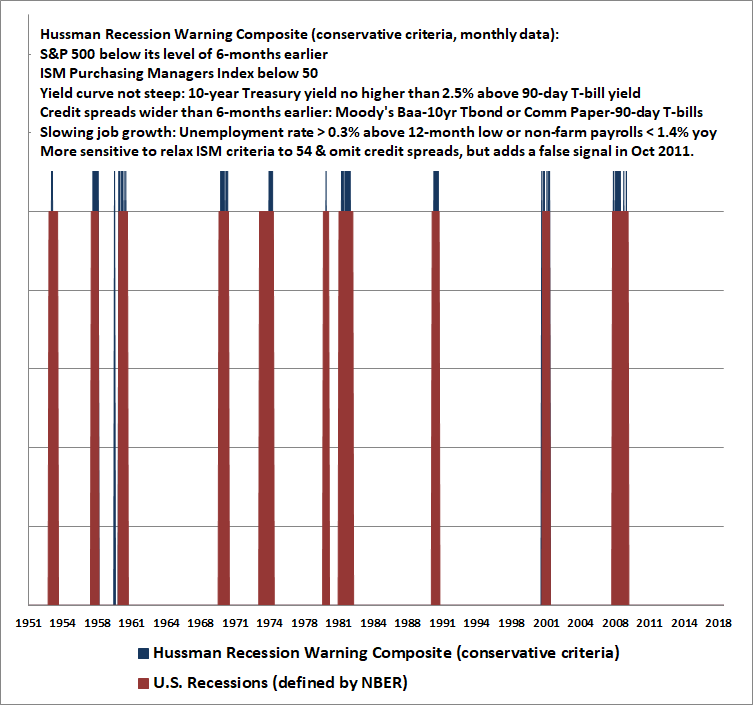
The central point is not to propose that any particular recession warning composite is bulletproof, but instead to observe that all of the criteria necessary to define the risk of an oncoming recession are factors that can change in the blink of an eye, with little more than a concerted 6-month deterioration in a variety of economic and financial indicators.
From that perspective, it’s madness to imagine that one can say, with any confidence at all, that the next recession will be deferred until 2020. Frankly, we have to allow for the possibility that the U.S. could be in a recession even by the end of 2018, because all of these warning signs could be in place with just a modest amount of deterioration. Presently, we don’t observe the indications of an oncoming recession. It’s just that, as noted earlier, there is rarely a significant amount of warning that separates periods of extreme optimism from outright recession.
While we presently don’t observe the signs of an oncoming recession, we’re often asked how the market could possibly lose two-thirds of its value without one. The answer is that a recession warning will likely come after market losses are already underway, not before.
With respect to the financial markets, present conditions already encourage a highly defensive, even hard-negative investment outlook. Evidence of an oncoming recession is not needed as a condition for a defensive position. To the contrary, a significant market decline will be among the factors that will warn of an oncoming recession.
If the condition of market internals improves, we would be inclined toward a constructive outlook (with a safety net) despite record valuations. Meanwhile, strength in equity markets and corporate credit would also suppress the likelihood of a recession. If there’s a sustained market advance ahead, there’s a strong likelihood that we would observe that sort of improvement in internals, which would enable our participation. So we can happily welcome a sustained market advance if that unfolds. But that’s not what the evidence suggests here. For now, and until market conditions shift, there’s an open trap door under the equity market, and it’s a very long way down.