via hussmanfunds:
Like bubbles on the sea of matter borne,
they rise, they break, and to that sea return.
– Alexander Pope
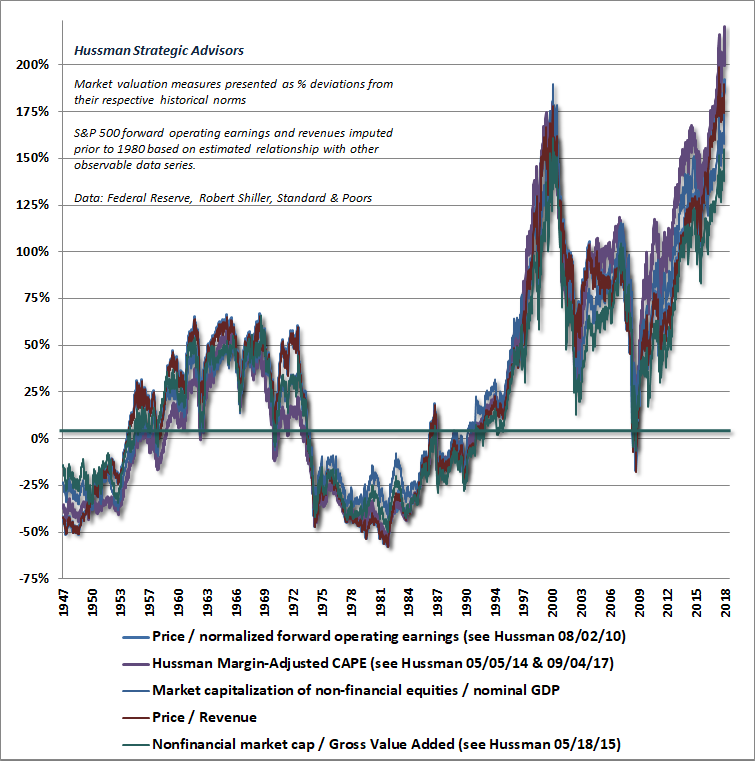
Last week, the stock market recorded the most offensive valuation extreme in history, on the basis of measures best correlated with actual subsequent returns across a century of market cycles. The advance brought the S&P 500 Index about 1% above its previous January 26 record. The current extreme eclipses both the 1929 peak, and the 2000 bubble peak.
I am aware of no plausible conditions under which current extremes are likely to work out well for investors. There are a few possibilities that could involve a smaller loss than the two-thirds of market capitalization that I expect to vanish, as the run-of-the-mill, baseline expectation for the S&P 500 over the completion of this cycle. Yet it’s worth recognizing that the completion of every market cycle in history has taken the most reliable valuation measures we identify (those best correlated with actual subsequent S&P 500 market returns) to less than half of current levels.
Still, be careful about what you do with information about valuations. If overvaluation was sufficient to halt a market advance, we would never have observed valuations like 1929, 2000, and today, because those advances would have ended at lesser extremes. It’s common to imagine that if valuations have pushed to extreme levels without a collapse, there must be something wrong with the valuation measures. But that’s not how valuations work.
The central fact of full-cycle investing is that when investors have the speculative bit in their teeth, valuations can mean very little for extended segments of the market cycle. In our own discipline, we infer that psychological inclination of investors from the uniformity or divergence of market action across thousands of securities, including debt securities of varying creditworthiness. We don’t disclose our own measures of market internals, but the key idea is that when investors are inclined to speculate, they tend to be indiscriminate about it. In contrast, when speculation becomes increasingly selective and narrow, it suggests growing risk-aversion among investors. That’s when extreme valuations suddenly become important, and the market becomes vulnerable to collapse.
Historically, when trend uniformity has been positive, stocks have generally ignored overvaluation, no matter how extreme. When the market loses that uniformity, valuations often matter suddenly and with a vengeance. This is a lesson best learned before a crash rather than after one.
– John P. Hussman, Ph.D., October 3, 2000
In previous market cycles across history, there was one fairly rare exception. Once sufficiently extreme “overvalued, overbought, overbullish” conditions developed, the market would typically break lower regardless of whether market internals were favorable or not. These combinations of overvaluation, extreme sentiment, and overextended conditions placed a fairly reliable limit on further market advances. That’s why I warned on July 16, 2007, just 1% shy of the 2007 pre-crisis peak, that market conditions had joined a set of conditions that I called a “Who’s Who” of awful times to invest. Our measures of market internals deteriorated two weeks later, and the subsequent collapse went on to inflict a loss of more than -55% in the S&P 500.
One of the best indications of the speculative willingness of investors is the ‘uniformity’ of positive market action across a broad range of internals. Probably the most important aspect of last week’s decline was the decisive negative shift in these measures. Now, it also happens that once the market reaches overvalued, overbought, overbullish conditions, stocks have historically lagged Treasury bills, on average, even when those internals have been positive (a fact which kept us hedged). Still, the favorable internals did tell us that investors were willing to speculate, however abruptly that willingness might end.
– John P. Hussman, Ph.D., July 30, 2007
In recent quarters, I’ve detailed how the advancing half-cycle since 2009 was legitimately different than previous cycles across history. The difference was simple in hindsight, but so difficult to accept in the face of a century of market evidence to the contrary that it became my Achilles Heel. History had taught that sufficiently extreme conditions placed a “limit” on speculation. Once interest rates hit zero, that belief proved to be dead wrong. Worse, even after interest rates moved above zero, overextended syndromes continued to be useless. What was required, and the way we ultimately adapted, was to refrain from adopting negative market outlook – regardless of how extreme “overvalued, overbought, overbullish” conditions became – until our measures of market internals deteriorated explicitly.
That deterioration occurred most recently on February 2nd of this year. Our measures of market internals remain unfavorable here, largely because of narrowing leadership, divergent market action among individual stocks, and weakness in corporate bonds. It’s important to emphasize that improvement in our measures of market internals would shift our immediate market outlook to a neutral and possibly even constructive view (with a strong safety net), regardless of valuations that I view as obscene. At this point in the cycle, it should be no surprise that we insist on a safety net in any event, but even that will change as market conditions do.
The strongest market return/risk profiles emerge when a material retreat in valuations is joined by an early improvement in our measures of market action. I fully expect to adopt a constructive or aggressive market view in response to that eventuality. Despite my inadvertent “permabear” label, I’ve actually adopted a constructive or aggressive investment stance after every bear market in over three decades as a professional investor, though my 2009 insistence on stress-testing our methods against Depression-era data admittedly truncated the constructive shift I adopted in late-October 2008.
Generally speaking, the hallmark of trend uniformity is ‘lack of negative divergence.’ We don’t measure the extent or duration of an advance – rather, we measure the quality of market action in terms of its agreement over a wide range of indices, industries, and security types (both stocks and bonds). Last month, the stock market recruited enough ‘trend uniformity’ to shift the Market Climate to a favorable condition. This is the first comprehensive shift in trend uniformity since it turned decisively unfavorable on September 1st, 2000. Since then, the S&P 500 has lost over 40% of its value.
– John P. Hussman, Ph.D., May 12, 2003
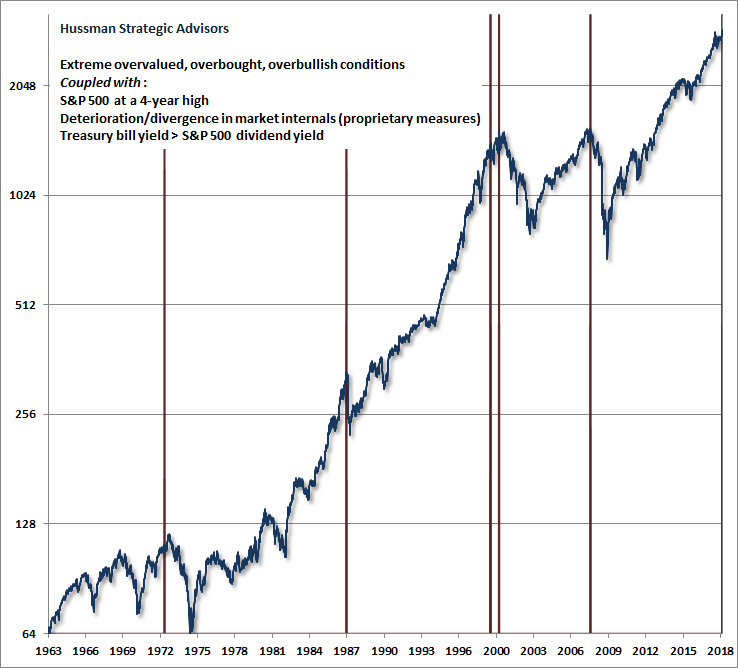
Here and now, my sense is that many investors have dismissed the violently negative conditions that are presently in place. The chart below highlights the essential facts. While we’ve observed nearly perpetual “overvalued, overbought, overbullish” syndromes for years during the recent half-cycle, the current extreme is combined with unfavorable market internals, which indicates a subtle shift of investor psychology toward risk-aversion, and opens up a trap door below the market. Equally important, many yield-seeking speculators were drawn to a dividend yield on the S&P 500 that exceeded Treasury bill rates in recent years. That is also no longer the case (as it was even at the January peak).
We always have to allow for the possibility that market internals could improve, indicating that investors had taken an indiscriminate speculative bit in their teeth again. Favorable internals would encourage us to adopt a more neutral or constructive (with a safety net) near-term outlook. But faced with the same conditions we observe at present, investors have historically found nothing but trouble.
Valuation review
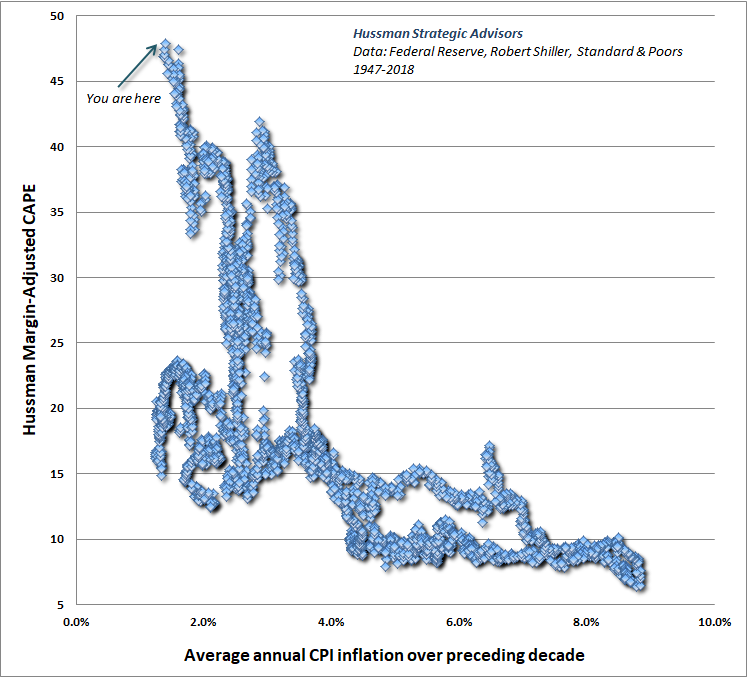
The chart below shows our Margin-Adjusted CAPE, which improves the reliability of Robert Shiller’s cyclically-adjusted P/E by adjusting for the embedded profit margin. Last week’s market advance brought this measure to a fresh record high, easily eclipsing both the 1929 and 2000 market peaks.
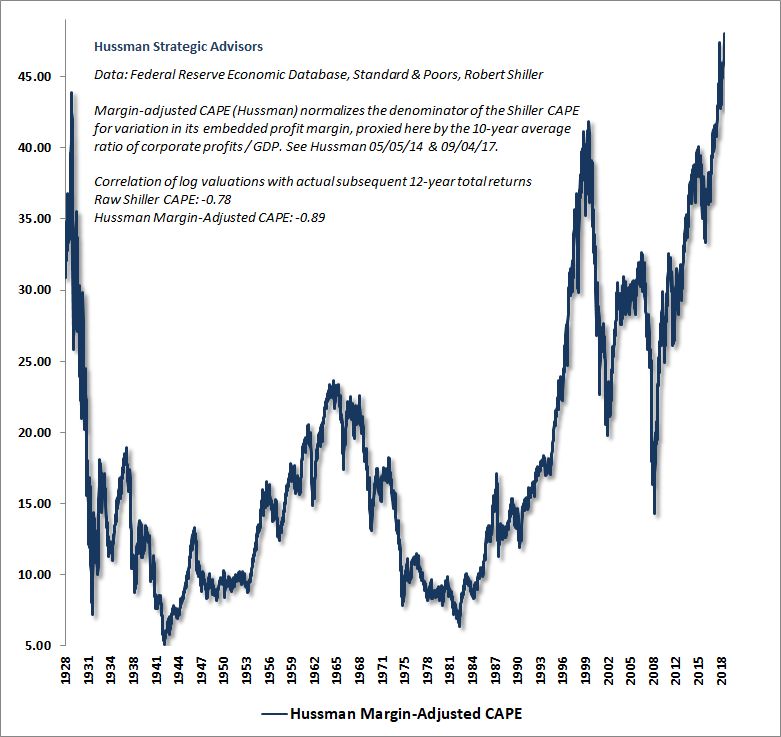
Current stock market capitalization is largely an artifact of speculative psychology, not reasonably discounted cash flows. Unless investors rely on eternal sunshine of the spotless mind – the assumption that current levels of extreme cyclical optimism will be permanent – they should not expect the associated valuation extremes to be permanent either.
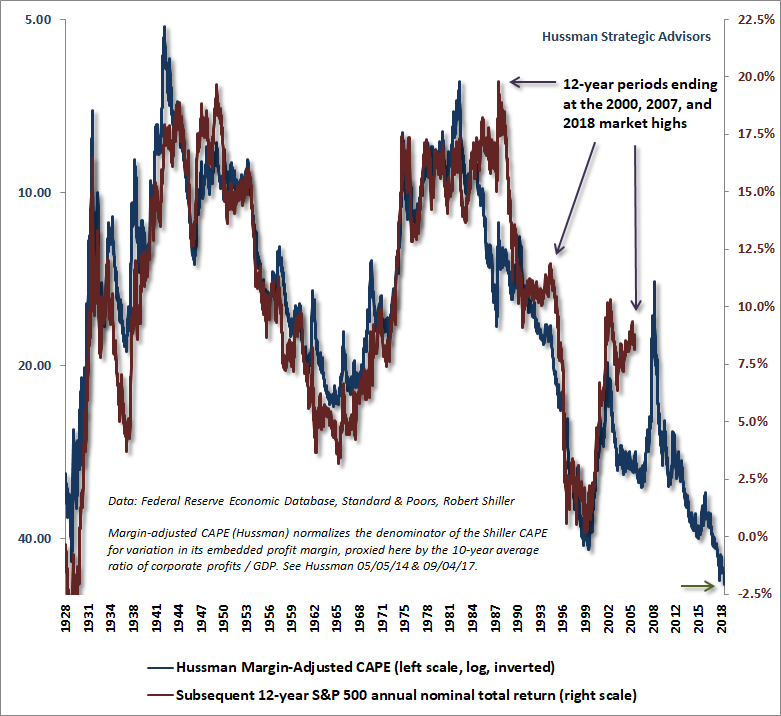
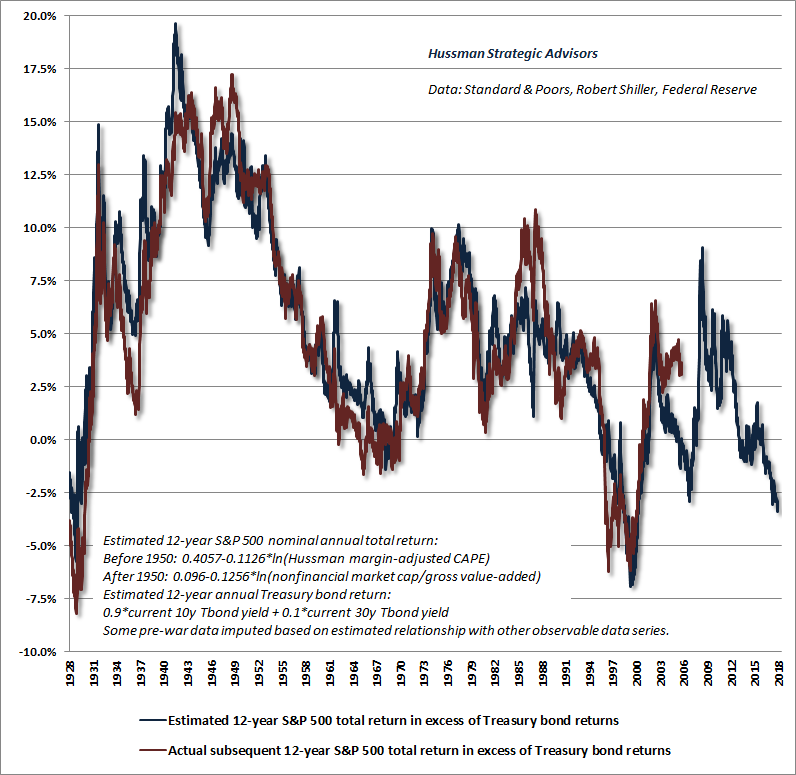
The next chart shows the Margin-Adjusted CAPE on an inverted log scale (left), along with actual subsequent S&P 500 average annual nominal total returns over the subsequent 12-year period. At present, our estimate for S&P 500 12-year total returns is clearly negative. Remember that the way to generate strong past returns is to drive valuations far beyond their norms, which in turn sets up the likelihood of dismal future returns. We saw the same process at play at the 2000 and 2007 highs, when the 12-year return of the S&P 500 exceeded, temporarily, the return that one would have projected on the basis of valuations.
In my view, the exodus of investors toward passive investment strategies is largely a form of performance-chasing. The mantra of passive investors that “even if the market drops, it will come back over time” is quite valid when market valuations are reasonable, but it becomes a very long-term proposition when valuations are extreme. In my view, the prospect of negative total returns for the S&P 500 over the coming 12-year period isn’t a worst-case scenario. It’s a completely run-of-the-mill, historically probable expectation given present extremes.
Not wanting to accept these prospects, we observe some investors arguing that the Federal Reserve could easily bail investors out and generate higher nominal returns by generating high inflation. The problem here is that investors predictably respond to higher inflation by crushing market valuations. That tendency, in data since 1947, is illustrated in the chart below.
Even today’s relatively low rate of inflation would be perfectly consistent with valuations less than half of current levels. But give investors a material amount of inflation, and investors could easily drive current valuation extremes down by three-quarters (which would bring them closer to what we observed, for example, in 1974 and 1982). Cut valuations by three quarters, and it would take a quadrupling in the CPI to offset the negative effect on nominal returns.
So yes, if one wishes to envision the U.S. becoming Argentina, where the inflation rate recently hit 30%, one could expect a sufficiently extended period of inflation to produce positive nominal returns. But real returns would still suffer by virtue of contracting valuations, which require prices either to decline, or to grow slower than nominal fundamentals.
At very depressed valuations, central bank actions can have an effect on market outcomes by encouraging yield-seeking speculation, provided that investors are inclined to embrace risk. Recall, however, that the Fed eased persistently and aggressively throughout the 2000-2002 and 2007-2009 collapses, with little effect. That’s because when investors are risk-averse, safe liquidity is a desirable asset rather than an “inferior” one, so creating more of the stuff doesn’t drive investors to chase riskier assets.
In my view, investors are grasping at straws if they are relying on the Fed to prevent the damage from an increasingly likely market collapse. Not that the Fed won’t try, but remember that the effect of Fed actions on market outcomes, like the impact of valuations, is entirely dependent on the psychological inclination of investors toward speculation or risk-aversion. That’s why the information we extract from the uniformity or divergence of market internals is so important to our market outlook.
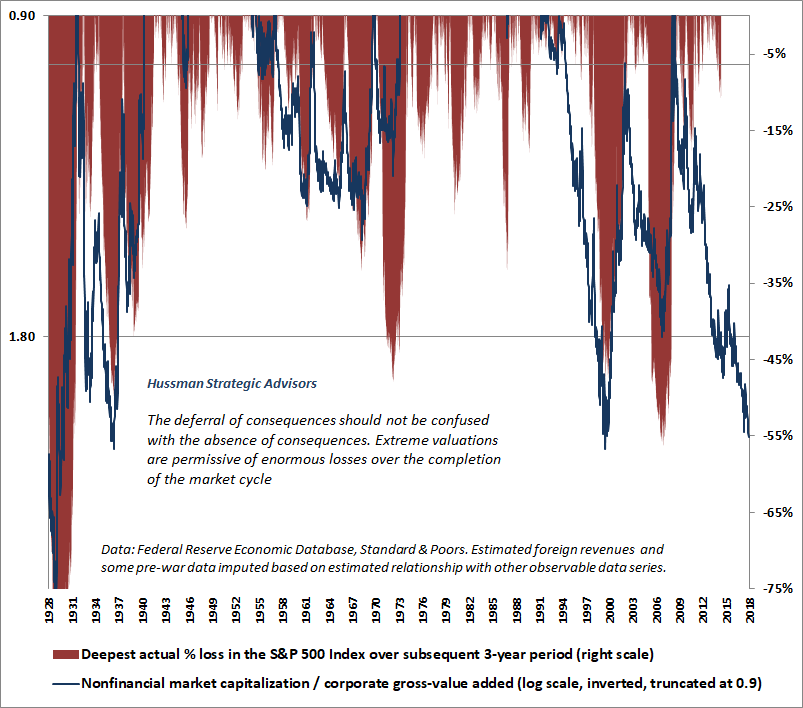
Investors should understand that extreme valuations go hand-in-hand with extreme losses over the completion of the market cycle. The chart below illustrates this relationship. At left is the ratio of nonfinancial market capitalization to corporate gross value-added (our most reliable valuation measure, which I introduced in 2015). The left axis is an inverted log-scale, truncated at 0.90, which is near the long-term norm for MarketCap/GVA. The zero line therefore reflects normal valuations, and lower levels on the blue line correspond to more extreme overvaluation. The red shading shows the deepest subsequent loss of the S&P 500 over the following 3-year period.
Notice that approaching the 2000 and 2007 peak, the blue line plunged for quite a while, with the corresponding market losses in red showing up later. That nicely illustrates the fact that rich valuations can persist for some time, without consequence, as long as investors remain inclined toward speculation. But as we saw in 2000, and 2007, and as I expect to see today, once market internals deteriorate, steep valuations become extremely dangerous, and are also extremely informative about the size of likely market losses over the completion of the cycle.
Eternal sunshine of the spotless mind
In August 2007, shortly before the global financial crisis unfolded, I observed that strong economic optimism is a contrary indicator:
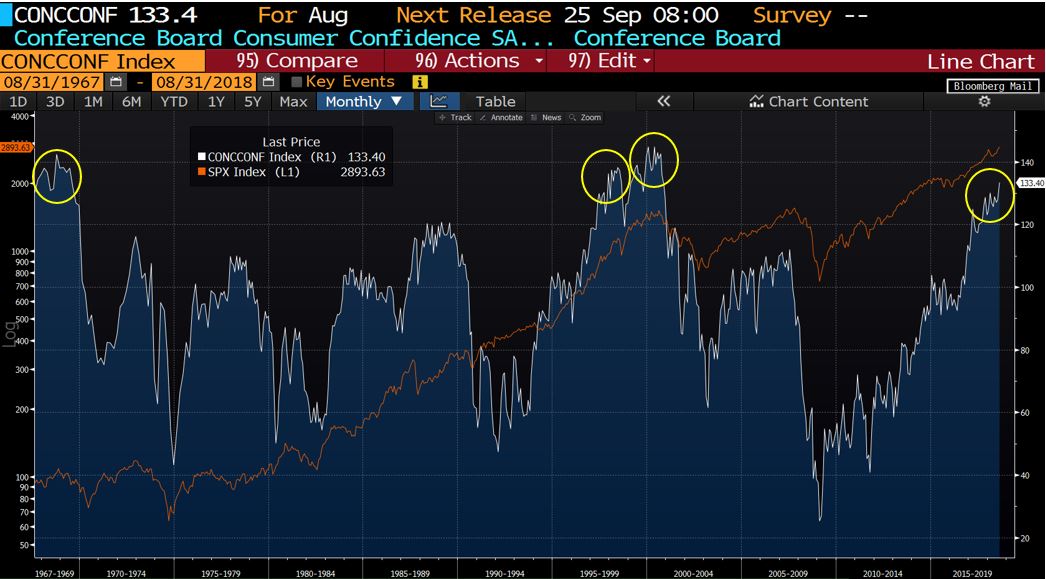
“Despite credit concerns, Wall Street remains exuberant about economic prospects. Last week brought a 6-year high in consumer confidence, evidently supporting the idea that the consumer remains strong and the economic expansion remains intact. Unfortunately, if you examine the data, you’ll quickly discover that consumer confidence is a lagging indicator, well explained by past movements in GDP, employment, and capacity utilization. Worse, for the stock market, it’s a contrary indicator (especially when it is well above the “future expectations” component of the same survey). This is a fact that I’ve noted at both extremes, not only in early 2000 when new highs in consumer confidence supported a defensive position, but conversely in the early 1990’s, when new lows in consumer confidence supported a leveraged position in stocks (prompting that ‘lonely raging bull’ comment in the L.A. Times). High levels of economic optimism are regularly observed at the peaks of both U.S. and foreign economic expansions. This includes the general consensus of individuals, businesses, politicians, central bank officials and notoriously – economists. That shouldn’t be surprising. It’s the very nature of a peak that it can’t be produced except by unusual optimism.”
Last week, consumer confidence pressed to a fresh cyclical high. As Tavi Costa at Crescat Capital observed, similar extremes in consumer confidence have regularly preceded substantial market losses. If market internals were favorable here, indicating a continued inclination of investors to speculate, I would view the extremes in confidence, valuations, sentiment, and price action with a much more neutral eye. But until investor psychology shifts away from risk aversion, as evidenced by uniform market internals, the market remains vulnerable to severe losses.
Consumer confidence provides a striking illustration of how temporary psychological factors interact with the long-term and full-cycle effects of market valuation. Despite my error in believing that historically well-defined limits to speculation would survive the Federal Reserve’s deranged experiment with quantitative easing and zero interest rates, I’ve argued for decades that valuations drive long-term and full-cycle market outcomes, while shorter term psychology controls outcomes over shorter segments of the market cycle.
Recall that reliable valuation measures like our Margin-Adjusted CAPE and MarketCap/GVA are tightly correlated with actual subsequent market outcomes across history. But if you look closely, you’ll also notice that there are points like 2000, 2007, and today where the actual total return of the S&P 500 over the most recent 12-year period was higher than the return that one would have predicted 12-years earlier, based on valuations at the time.
What should we conclude from this? At each extreme, investors argued that valuations were no longer relevant, and had stopped “working.” Those investors were ultimately punished for that belief. If you look closer, you’ll discover what’s really going on.
The blue line in the chart below shows the “errors” in our 12-year return projections for the S&P 500. Specifically, it shows the actual 12-year total return for the S&P 500, minus the 12-year total return that one would have projected based on the valuations that prevailed 12 years earlier. The largest positive “errors” correspond to points of historical overvaluation. That’s no surprise. The way the market produces outsized returns is by driving valuations to breathtaking extremes.
Now notice the red line. That’s consumer confidence (h/t Mark Louis for observing this relationship). Although valuations drive long-term and full-cycle returns, it’s clear that temporary, cyclical fluctuations in psychology, both positive and negative, are the main reason that “errors” sometimes emerge over shorter segments of the market cycle. In an ideal world, we would know both the starting level of valuation, and also the temporary, cyclical level of consumer confidence 12-years into the future. Unfortunately, we don’t know what future confidence levels will be. But we do know that variations in consumer confidence are impermanent, and at extremes like today, that’s a critical piece of knowledge.
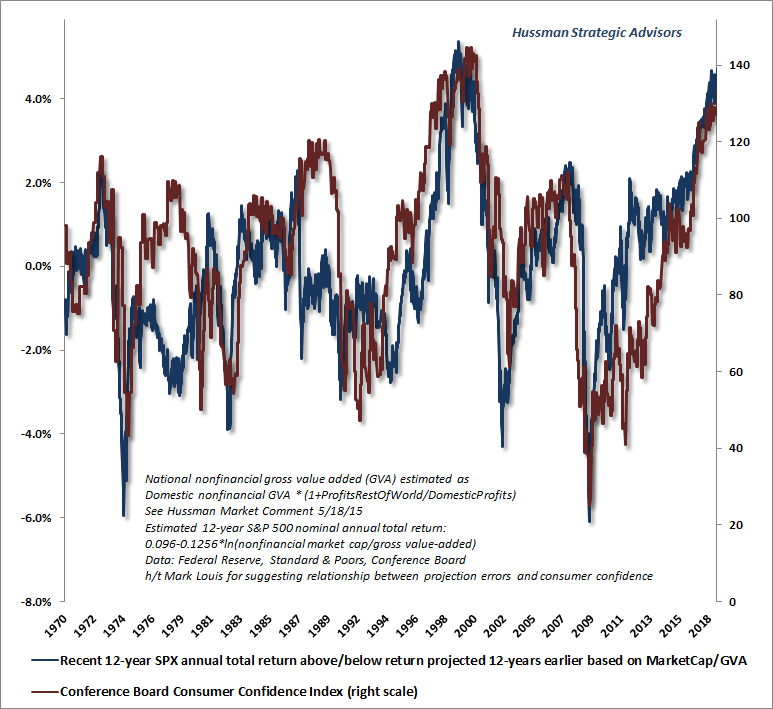
Look carefully at the above chart. Over the past 12 years, as stocks have moved to bubble valuations, the S&P 500 has gained about 4.7% annually in excess of what one would have expected it to gain on the basis of 2006 valuations. That outcome has emerged hand-in-hand with the current, temporary exuberance in sentiment. There’s most likely a feedback here – the strong performance of the market may help to boost consumer confidence, and strong consumer confidence may help to support the market. The feedback may be self-reinforcing over short periods, but mean-reversion clearly dominates over the economic cycle, as investors fluctuate between extremes of optimism and extremes of pessimism.
Notice that the zero level on “errors” is associated with a level of about 90 on consumer confidence, well above the range of 30-60 that has typically been observed during recessions. This implies that even a rather minor cyclical deterioration in consumer confidence would probably be associated with a complete elimination of that 4.7% annual “error,” implying a likely market loss of roughly -43%.
Current stock market capitalization is largely an artifact of speculative psychology, not reasonably discounted cash flows. Unless investors rely on eternal sunshine of the spotless mind – the assumption that current levels of extreme cyclical optimism will be permanent – they should not expect the associated valuation extremes to be permanent either. Very deep market losses are likely, even in the absence of a recession.
Stocks, bonds, and the option value of cash
One of the questions we often hear is, “If you had to choose stocks or bonds for a T-year investment horizon, and you couldn’t change your position, which would you choose?” Presumably, the requirement that you can’t change your position implicitly says that the question is about expected return, not potential volatility.
Historically speaking, the answer has generally been “stocks,” particularly when T is greater than 3-5 years. But once valuations move into the top 20%, the answer generally favors bonds, especially in periods where market internals have deteriorated. Moreover, if the yield-curve is rather flat (so you don’t earn much extra return for extending your maturity), cash actually becomes the preferred asset. If one allows for the possibility of changing the investment position in response to market fluctuations, cash becomes even more dominant. That’s because when valuations are high and market internals are unfavorable, the ability to respond to steep market declines by shifting from cash to stocks can be enormously useful.
Novice investors, and sadly some professionals, seem imagine that it is the birthright of stocks to generate a pleasant average expected return, such as 10% annually, regardless of valuations. This ignores the drivers of investment returns. The 10% figure is an average outcome that was historically driven by a combination of nominal growth in earnings, revenues, dividends, and other fundamentals averaging just over 6% annually, plus an average dividend yield of just under 4% annually.
The problem is that a striking proportion of market returns in recent years has been driven by a spike in valuations to bubble extremes, while the underlying fundamental drivers have languished. Indeed, when we measure peak-to-peak across economic cycles, annual S&P 500 earnings growth has averaged less than 3% annually since 2007, while S&P 500 revenue growth has averaged less than 2% annually (the difference reflects a move to record profit margins). Both figures include the impact of stock buybacks. Meanwhile, the dividend yield of the S&P 500 is now less than 2%. Add that yield to the growth rate, and even permanently elevated valuationswould only be associated with expected nominal total returns of about 4-5% annually from these levels.
Here’s a little math. Given that our best measures of valuation are nearly three times their historical norms, suppose that fundamentals grow at 4% annually, and valuations eventually decline to half of current levels – still elevated relative to history, but less extremely so. How many years of growth would be required in order to leave stock prices unchanged? The answer is ln(2.0)/ln(1.04) = 17.7 years. Think about that carefully. The dividend yield on the S&P 500 is presently below the Treasury bill yield of 2%. From current valuation extremes, even a retreat of valuations to levels 50% above their historical norms would leave stock market investors behind the lowly return on Treasury bills for easily more a decade.
That shouldn’t be a surprise, of course. By the end of the 2000-2002 market decline, the total return of the S&P 500 had fallen behind risk-free Treasury bills all the way back to May 1996. By the end of the 2007-2009 market decline, the total return of the S&P 500 had fallen behind risk-free Treasury bills all the way back to June 1995. I continue to expect the completion of the current market cycle to wipe out the entire total return of the S&P 500 since 2000, and to put it behind Treasury bills all the way back to late-1997.
The reason investors imagine that growth is running so much higher than 2-3% annually is that Wall Street and financial news gurgles about quarterly figures and year-over-year comparisons without placing them into a longer-term perspective. The chart below may be helpful in that regard. Notice in particular that despite the impact of stock buybacks, we’re observing the same slowdown in corporate fundamentals as we observe in structural GDP growth, which I’ve discussed in prior comments.
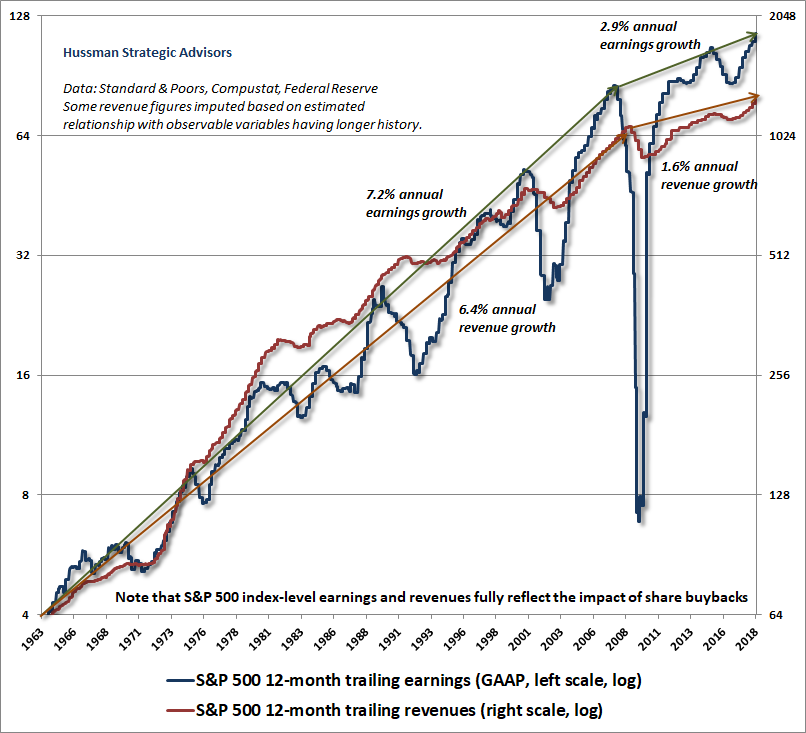
As a side note, recall that the “structural” component of GDP growth is driven by average annual productivity growth (about 0.8%) plus labor force growth (about 0.6%). The remainder of GDP growth is driven by “cyclical” changes in the unemployment rate. The way to “reconcile” the likely 1.4% structural growth rate of GDP with the 4% second quarter growth rate of real GDP is to observe that one is an expected multi-year average and the other is the annualized figure for a single quarter, where a good portion of that figure was driven by soybean exports in anticipation of tariffs.
So yes, historically the total return on stocks has exceeded the total return on bonds. But that has not been true starting from elevated valuations. Meanwhile, though many investors imagine that low bond yields somehow “justify” elevated equity valuations, this assumes that the trajectory of future cash flows is held constant. When interest rates are low because growth rates are low, stocks deserve no valuation premium at all, yet even “normal” valuations generate below-average stock market returns, via the lower growth rate. The chart below provides the most extended perspective on the matter that I can offer. Emphatically, I expect the S&P 500 to underperform even the depressed yield on Treasury bonds over the coming 12-year period.
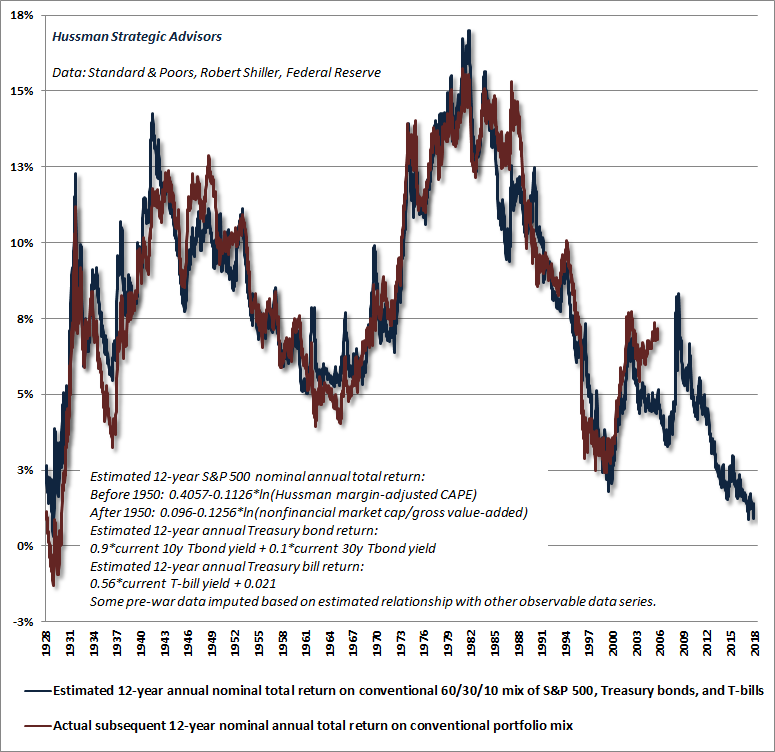
Finally, the chart below draws together our estimates of prospective returns on a passive 60/30/10 mix of the S&P 500, Treasury bonds, and Treasury bills. From current valuations, we expect that the total return from passive investment strategies will average less than 1% annually over the coming 12 years. The popularity of passive strategies is simply a form of performance-chasing, encouraged by an ascent to abominably high valuations, and wholly ignorant of the dismal prospective returns associated with those valuations.
Again, given current valuation extremes in stocks, unfavorable market internals, and a relatively flat yield curve in bonds, I believe that lowly, humble cash has substantial option value, because it offers the opportunity to respond to potentially deep market losses. The strongest estimated market return/risk prospects emerge when a material retreat in valuations is joined by an early improvement in our measures of market action.