DEFORM THE COST OF #MONEY (#INTERESTRATES), DEFORM THE VALUE OF EVERYTHING


twitter.com/OccupyWisdom/status/1007487736096411648
twitter.com/jtepper2/status/1007250459780886528
This is the #SP500 and #Bitcoin (with bitcoin brought 47 days forward). If the correlation (which began after BTC traded on CME) continues, we will see a significant drop in equities. pic.twitter.com/A4szWTbzOZ
— OW (@OccupyWisdom) June 15, 2018
Bitcoin $BTC support levels:
̶1̶9̶,̶0̶0̶0̶
̶1̶8̶,̶0̶0̶0̶
̶1̶7̶,̶0̶0̶0̶
̶1̶6̶,̶0̶0̶0̶
̶1̶5̶,̶0̶0̶0̶
̶1̶4̶,̶0̶0̶0̶
̶1̶3̶,̶0̶0̶0̶
̶1̶2̶,̶0̶0̶0̶
̶1̶1̶,̶0̶0̶0̶
̶1̶0̶,̶0̶0̶0̶
̶9̶,̶0̶0̶0̶
̶8̶,̶0̶0̶0̶
̶7̶,̶0̶0̶0̶
6,000
5,000
4,000
3,000
2,000
1,000
666
420
69
0— Ramp Capital♿️ (@RampCapitalLLC) June 13, 2018
Tesla Net Income: -$2.3 billion
Ford Net Income: +$7.8 billionTesla Free Cash Flow: -$4.4 billion
Ford Free Cash Flow: +$10.2 billionTesla Market Cap: $59 billion
Ford Market Cap: $48 billion pic.twitter.com/B9jt3kVhRq— Charlie Bilello (@charliebilello) June 14, 2018
via Of Two Minds:
The whole of Wall St.’s perpetual enrichment, at the expense of retail customers who get fleeced for outrageous fees for no good reason, is based on their driving the perception that investing is far too difficult and scary for you to do on your own.
To that end, it spends over $10 billion a year in digital advertising alone, nurturing the illusion that they care about anything other than taking your money (wrong) and that you’re best off letting them manage your money (very, very wrong).
Further, the vast majority of investment advisors and financial managers only invest in one direction: long. They are never going to tell you it’s a bad time to give them more money to invest for you. They will always be bullish on the market. Because they’re not investors. They’re just salesmen. And their job is to sell you on the lie that investing with them is a good idea.
Because they want to make money, at your expense, much more than they care about protecting you from enormous losses in the coming crash.
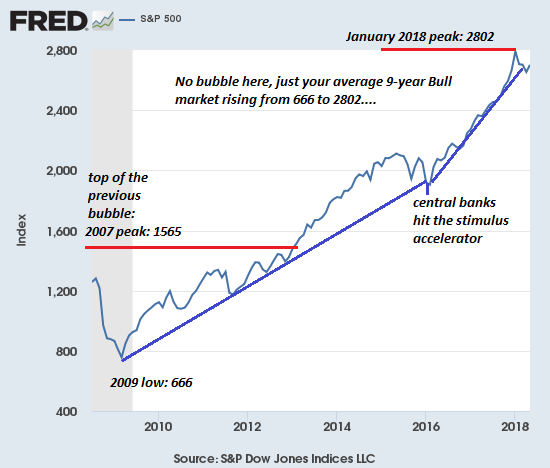
Don’t fall for the expensive suit, fake smile, and smooth talk. Take a step back. Look at the three charts below. Draw your own super-obvious conclusion about whether we’re in the midst of a massive bubble that is doomed to pop, and invest in real, perpetual stores of long term value.


Is anyone actually dumb enough not to recognize these are bubbles? Of course not. Those proclaiming that “these bubbles are not bubbles” know full well they’re bubbles, but their livelihoods depend on public denial of this reality.
And so we’re inundated with justifications of bubble valuations, neatly bound with statistical mumbo-jumbo: forward earnings (better every day in every way!), P-E expansion, and all the rest of the usual blather that’s spewed by status quo commentators and fund managers at the top of every bubble.
The problem with bubbles is they always pop. The market runs out of Greater Fools and/or creditworthy borrowers, and so sellers overwhelm the thinning ranks of buyers.
Those dancing euphorically, expecting the music will never stop, are caught off guard (despite their confidence that they are far too clever to be caught by surprise), and the panic-driven crowd clogs the narrow exit, leaving a ballroom of bag-holders to absorb the losses.
Interest Rates Rising At Fastest Clip In 20 Years!

With the Federal Reserve in interest rate “hike” mode, the market is on edge about the speed with which rates will rise.
Rates have been rising at a pretty steady clip over the past couple of years… and apparently it’s getting investors attention!
In fact, the past two years have seen treasury yields rise at the fastest clip in 20 years! More on that below.
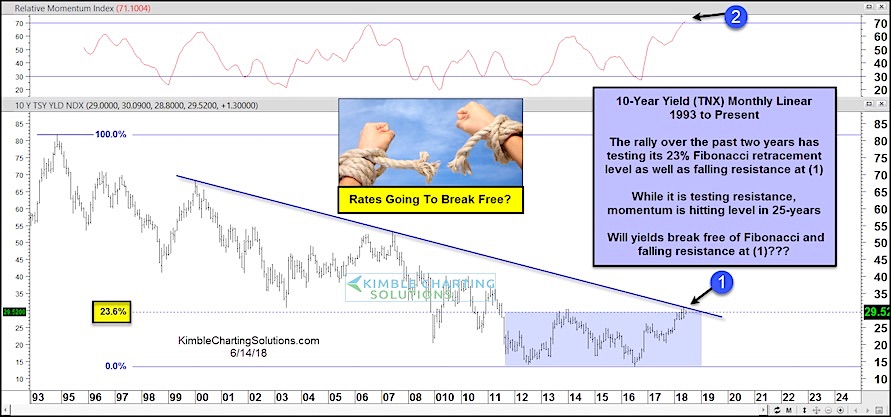
The current rally has the key 10-year treasury yield (TNX) testing important downtrend resistance.
This resistance line is highlighted on both charts in today’s 2-pack.
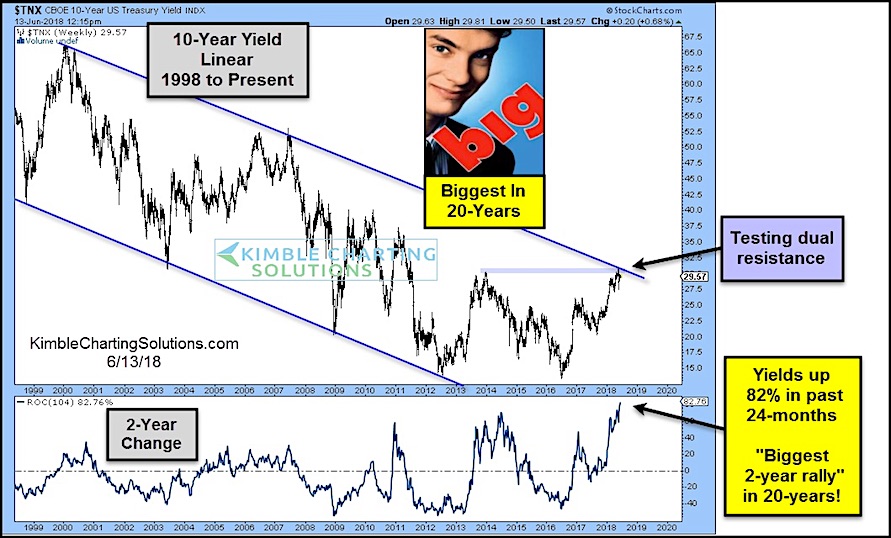
First we look at a long-term “Weekly” Chart (see below). The Rate Of Change (ROC) indicator shows yields up 82% vs 2 years ago… this marks the biggest 2-year rally investors have seen during the last 20 years.
At the same time, the 10-year yield is testing important dual resistance marked by the falling downtrend line and the December 2013 highs.
Are we due for breather? Keep an eye on current levels! A breakout here would have important implications for portfolio managers.
$TNX 10 Year U.S. Treasury Yield “Weekly” Chart
