Let me start out by saying I hate market comparisons.
While history certainly does “rhyme,” they are never the same. This is especially the case when it comes to the financial markets. Chart patterns may align from time to time, but such is more a function of pattern-fitting than anything else.
However, when it comes to fundamentals, standard-deviations, extensions, etc., it is a different story. A recent articleby Ryan Vlastelica brought this to mind.
“While the strategy of investing in internet-related companies will likely always be first associated with the dot-com era, the long-lived bull market has proved to be just as strong a period for a sector that has influenced nearly every aspect of the economy.
Friday marks the ninth anniversary of the financial crisis bottom, and since that period—by one measure, the start of the current bull market—internet stocks have been among the best performers on Wall Street.”

“’The current tech rally is possibly the greatest investment story ever told,’ wrote Vincent Deluard, global macro strategist at INTL FCStone, who was speaking about the sector broadly, and not these ETFs in particular. He noted that the MSCI World Technology Index has added $5.7 trillion in market capitalization since February 2009, ‘when the entire sector amounted to just $1.5 trillion.’”
Since Ryan was probably in elementary school during the “Dot.com” era, and many current fund managers weren’t managing money either, it is easy to dismiss “history” under a “this time is different” scenario. Even the ETF’s used as an example of the “this time is different” scenario didn’t even exist prior to the “dot.com bubble” (The QQQ didn’t come into existence until 1999)
Unfortunately, while the names of the companies may have changed, the current “dot.com boom” is likely more than just a “rhyme” with the past.
Investors Once Again Being Misled
From a fundamental basis, there is a difference between today and the “Dot.com days of yore.” In 1999, “dot.com”companies were all bunched together and few actually made money. Fast forward to 2018, and the division between an “internet company” and every other company is now invisible. In fact, companies like Apple and Amazon are no longer even classified as “technology” companies but rather consumer goods companies.
But nonetheless, fundamentals don’t discriminate between classifications, and once again investors are paying excessively high prices for companies that generate very little, if any, profit.
Just after the “dot.com” bust, I wrote a valuation article quoting Scott McNeely, who was the CEO of Sun Microsystems at the time. At its peak, the company was trading at 10x its sales. (Price-to-Sales ratio) In a Bloomberg interview Scott made the following point.
“At 10 times revenues, to give you a 10-year payback, I have to pay you 100% of revenues for 10 straight years in dividends. That assumes I can get that by my shareholders. That assumes I have zero cost of goods sold, which is very hard for a computer company. That assumes zero expenses, which is really hard with 39,000 employees.That assumes I pay no taxes, which is very hard. And that assumes you pay no taxes on your dividends, which is kind of illegal. And that assumes with zero R&D for the next 10 years, I can maintain the current revenue run rate. Now, having done that, would any of you like to buy my stock at $64? Do you realize how ridiculous those basic assumptions are? You don’t need any transparency. You don’t need any footnotes. What were you thinking?
How many of the following “dot.com” companies do you currently own which are currently carrying price-to-sales in excess of 10x? (Price-to-Sales above 2x becomes expensive. If I included companies with P/S of 5x or more, the list was just too expansive for this post.)

As noted above, there were only 3-ETF’s that existed just prior to the “dot.com” bubble -SPY, QQQ, and DIA. In order to do some better comparative analysis, I had to dig to find a technology-based mutual fund that existed back in 1990. Not surprisingly, there were very few but the T. Rowe Price Science and Technology (PRSCX) fund fit the bill and tracks the technology index very closely.
When we compare the fund to Shiller’s CAPE ratio, not surprisingly, since Technology makes up a quarter of the S&P 500 index, there is a high correlation between Technology and overall market valuation expansion and contraction.
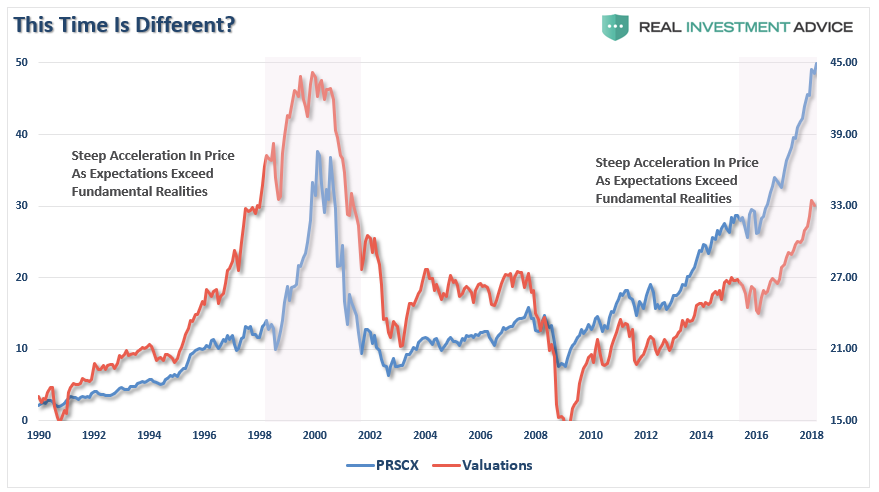
As was the case in 1998-2000, the fund exploded higher as exuberance over the transformation of the world was occurring before our eyes. Investors globally were willing to pay “any price” to “get in on the action.” Currently, investors are once again chasing returns in the “FANG” stocks with little regard to underlying value. The near vertical ramp in the fund is reminiscent of the late 1990’s as valuations continue to escalate higher.
The chart below shows this a bit more clearly. It compares the fund to both the RSI (relative strength index) and inflation-adjusted reported earnings of the S&P 500 on a QUARTERLY basis. Using quarterly data smooths volatility of these measures over time.
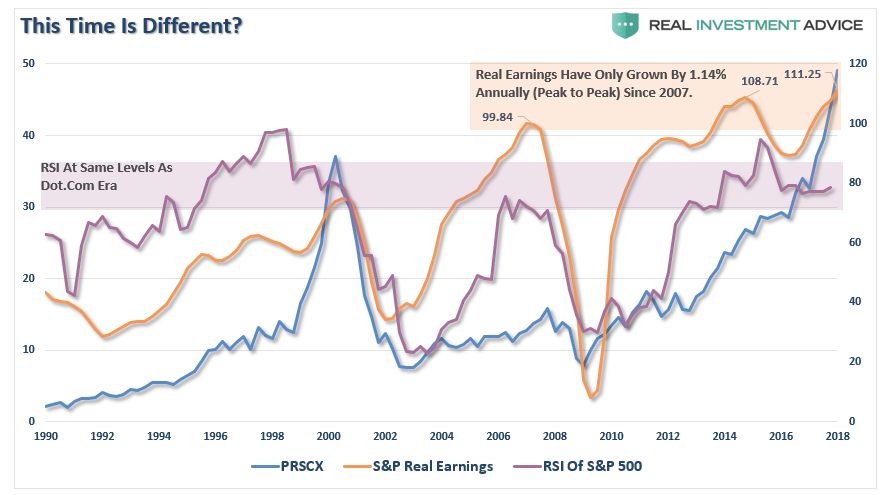
A couple of interesting points arise.
- The RSI of the market is as overbought today as it was leading up to the “Dot.com” crash and more overbought today than just before the “financial crisis.”
- Despite massive stock buybacks and cost reductions through wage and employment suppression, reported earnings have only grown by a little more than $11 / share since the peak of the market in 2007. In other words, despite the ongoing bullish commentary about how great earnings are, they have actually only achieved a 1.14% annualized rate of growth.
Of course, investors have disregarded the lack of real earnings growth. The valuation surge is also shown in the analysis below. I have taken the price of the fund and divided by the inflation-adjusted reported earnings of the S&P 500, or a modified “P/E” ratio. While not a strictly apples-to-apples comparison, the point is that since Technology makes up roughly 25% of the market, it is a big driver of the “P” and not a huge contributor to the “E.”
Again, on this basis, investors are once again paying a high price for poor fundamental quality in the “hope” that someday the fundamentals will catch up with the price. It has never been the case, but one can always “hope.”

Is The Dot.Com Bubble Back?
Whether you believe there is a “bubble” in the Technology stocks, or the markets, is really not important. There are plenty of arguments for both sides.
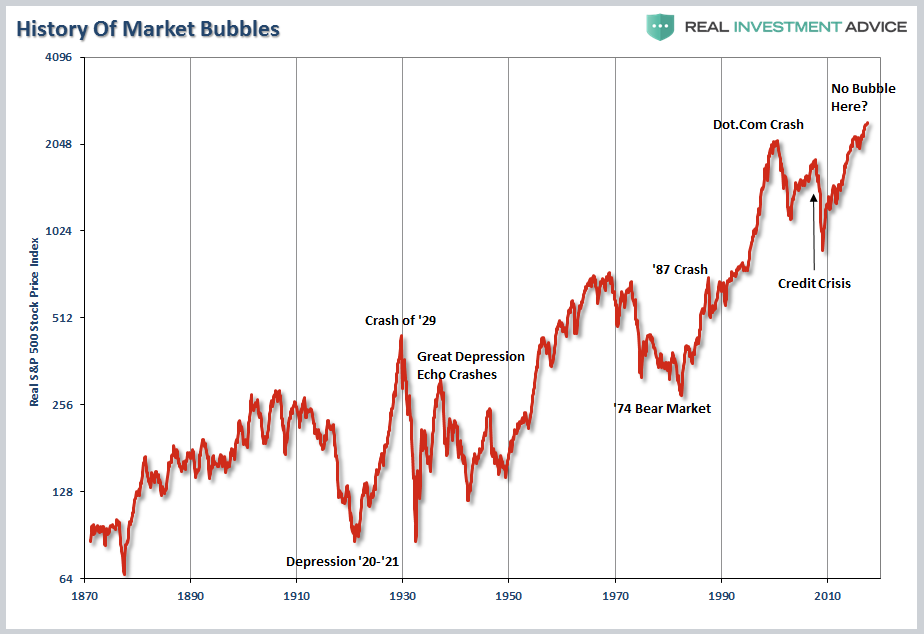
At the peak of every bull market in history, there was no one claiming that a crash was imminent. It was always the contrary with market pundits waging war against those nagging naysayers of the bullish mantra that “stocks have reached a permanently high plateau” or “this is a new secular bull market.” (Here is why it isn’t.)
Yet, in the end, it was something unexpected, unknown or simply dismissed that devastated investors.
This is why the discussion of “this time is not like the last time” is largely irrelevant.
Individuals no longer “invest” to become a “shareholder” in a publicly traded business. The “quaint concept” of “valuations” died with the mainstreaming of investing during the 1990’s as the “Wall Street Casino” opened for business.
Today, investors only think in terms of speculating on “electronically traded bits of paper” in the hopes the value will rise over time. The problem, of course, is they are never told when to “sell” to capture that valuation increase which is the most critical aspect of the investment process. Instead, individuals continue to “bet” the “greater fool” will always appear.
For now, the “bullish case” remains alive and well. The media will go on berating those heretics who dare to point out the risks that prevail, but the one simple truth is “this time is indeed different.”
“When the crash ultimately comes the reasons will be different than they were in the past – only the outcome will remain same.”
Eventually, like all amateur gamblers in the Las Vegas casinos, the ride is a “blast while it lasts” but in the end, the “house always wins.”
Lance Roberts

Lance Roberts is a Chief Portfolio Strategist/Economist for Clarity Financial. He is also the host of “The Lance Roberts Show” and Chief Editor of the “Real Investment Advice” website and author of “Real Investment Daily” blog and “Real Investment Report“. Follow Lance on Facebook, Twitter and Linked-In