via upfina:
Amid the volatile trading action and news on the trade war, let’s step back and recognize the stock market has been in a long consolidation phase for about a year now as economic growth slows. As you can see from the chart below, the 200 day moving average of the S&P 500 has been consolidating since the summer of 2018.
Look to the 200-day to smooth things out. After a massive leg higher in 2017, the S&P has been in a sideways consolidation phase for the last 18 months. Recently made a new high, though, and is trending higher. $SPY $$ t.co/H4p1RcpfIn pic.twitter.com/TZftG7ybI1
— Bespoke (@bespokeinvest) August 5, 2019
The S&P 500 had its 4th quickest 5% correction in this bull market since 2009. Only 11 stocks in the S&P 500 were up on August 5th which is the lowest total since Christmas Eve 2018. On the other hand, this is only the 2nd 5% correction of the year. Since 2009, the average is 3 per year. On average since 1928, there have been 17 daily declines of 2% or more per year; there have been 5 in 2019 as of August 5th.
Trade War Accelerates
We say nothing shocking happened because every time America has levied new tariffs on China, it has responded somehow. The US imports much more Chinese goods, therefore China can’t tax the US to the same degree using the same tactics. That doesn’t mean China can’t answer via other methods. Each country can negatively impact the other economically if it desires. However, hurting one’s own country in the process ruins the incentive to do so.
In response to the tariffs the yuan declined to slightly more than 7 to 1 to the dollar, putting it at its weakest level since 2008. In response to this currency move, the US labeled China a currency manipulator. As you can see from the chart below, the yuan depreciation has offset the effect of the US tariffs.
Exchange rate depreciation has virtually offset all of the effect of tariffs on Chinese exports – Citi pic.twitter.com/s1hzEHEJjV
— Sam Ro 📈 (@SamRo) August 5, 2019
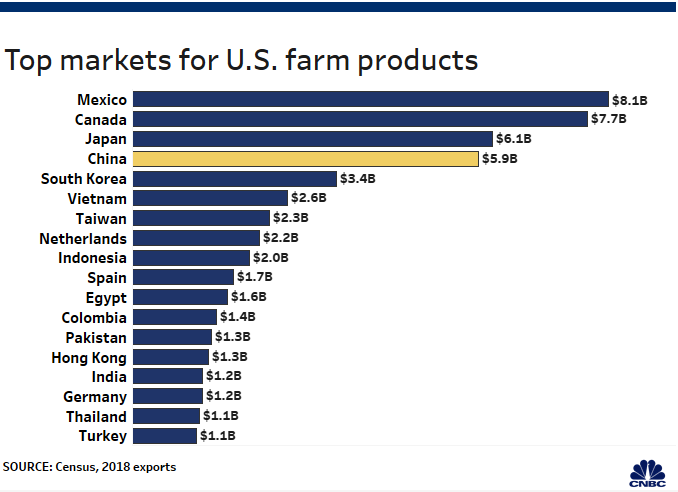
China also stated it will stop buying US agricultural products. From September 2017-May 2018 to September 2018-May 2019 soybean exports to China fell 70% to 7 million. As you can see from the chart below, China was the 4th largest market for U.S. farm products in 2018.
One of the goals with these trade negotiations has been to get China to let US companies fairly compete within its borders, so that could be at risk if the trade war accelerates further.
Global Economy Relies On Services
The global services economy actually improved in July unlike manufacturing. The global service sector output PMI increased from 51.9 to 52.5. Furthermore, the new business index improved from 52.6 to 53.1. However, the future activity index fell from 60.1 to 58.9.
As you can see from the chart below, all 13 countries Renaissance Macro tracks had services PMIs above 50, which is the most since last November.
Shades of 2015. How long can service industries hold out? In July, of the 13 countries we track, all saw services PMIs above 50, the best since November 2018. By contrast, just one-third of manufacturing PMIs globally are in expansion territory. pic.twitter.com/CJdFEvkXND
— Renaissance Macro (@RenMacLLC) August 5, 2019
The US, Germany, France, Spain, and India had service sector PMIs above the global average. The Chinese services activity index fell from 52 to 51.6. However, overall business optimism increased to a 3 month high. The Chinese composite index increased from 50.6 to 50.9 because of the improvement in manufacturing (49.4 to 49.9). Just 1/3rd of global manufacturing PMIs are above 50.
US Markit Services PMI Improves
The Markit services PMI improved and the ISM PMI fell. They are equivalent to similar economic growth rates, but different in rate of change terms. The July Markit services PMI improved from 51.5 to 53 as new business growth accelerated to a 4 month high. New international business hit a 5 month high. The weakest part of this report was that business optimism fell for the 6 straight month which is a new low for the series. The composite PMI of 52.6 is consistent with GDP growth of under 2%. That’s near the consensus of 1.9% Q3 GDP growth.
Revised data for US Services PMI in July indicates stronger growth for the start of Q3. The 53.0 print, up from 51.5 in June, puts a bit more distance over the neutral 50 mark. It's still a modest pace, but moving in the right direction. Will it continue? t.co/JyHjlIjjSe pic.twitter.com/J8bUuBQRaA
— James Picerno (@jpicerno) August 5, 2019
Lowest ISM PMI Since August 2016
The July non-manufacturing ISM PMI fell from 55.1 to 53.7 which is the weakest reading since August 2016. As you can see from the bottom chart, the composite index fell to 53.4 which is also the weakest reading since August 2016. The services production index fell 5.1 points to 53.1 and the new orders index fell 1.7 points to 54.1. The employment index was up 1.2 points to 56.2. Of the 10 quotes, 3 firms made direct references to tariffs and 2 made indirect references. A construction firm stated, “Tariffs continue to push costs higher, and customers are looking for more discounts due to mortgage-rate fluctuations.” One of the positives of this trade war and economic slowdown is mortgage interest rates are at a 3 year low.
It's been nearly three years since the ISM Services was this bad. t.co/SblhhCbX8N pic.twitter.com/A5YTHbtoNa
— Bespoke (@bespokeinvest) August 5, 2019
Conclusion
We don’t want to over-hype the trade war and stock market volatility, and in historical context, the recent decline is within norm. The media likes to emphasize how bad corrections are even though they occur every few months on average (it’s good for clicks). The 200 day moving average of the S&P 500 has been range bound because of the economic slowdown. This isn’t complicated stuff. The July non-manufacturing ISM PMI, however, continues to signal a slowdown with the composite index showing the weakest reading since August 2016, which is troubling, while the July US Markit Service PMI improved as new business growth accelerated.