via sentimentrader:
Fear is slipping
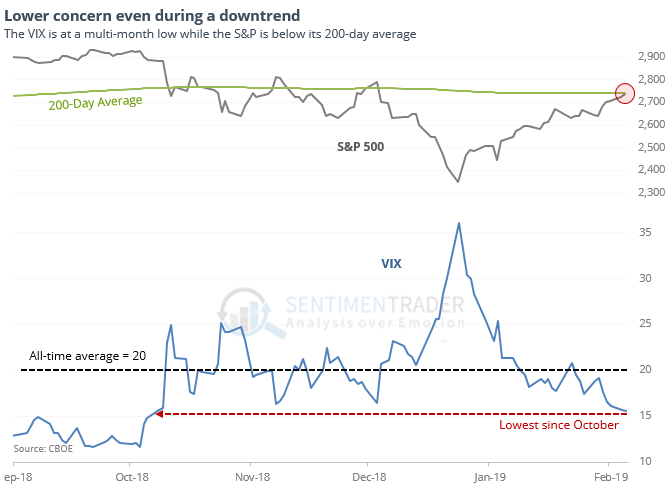
Even while the S&P 500 remains below its 200-day average, the VIX has slipped to a multi-month low and is well below its long-term average of 20.

This has consistently led to trouble over the short- to medium-term as the ebbing of concern showed that investors were too quick to price in lower volatility. Most notably, over the next six months only two days managed to sport a positive return, and those were small.
Anything but average
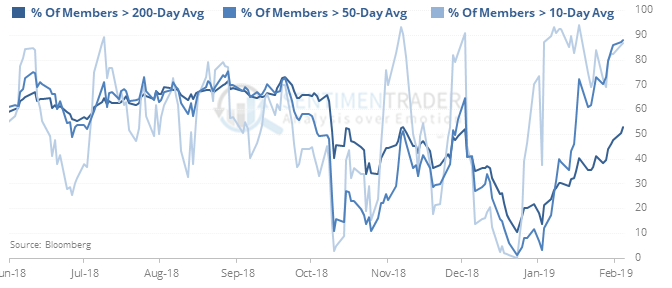
The thrust in stocks over the past few weeks has taken almost all S&P 500 stocks above their 10- and 50-day averages, while fewer than 60% of them have managed to climb above their 200-day averages.

Over the next month, it was quite negative, with only 3 gains versus 6 losses, and risk twice as large as reward. But after that, the thrusting nature of the signals led to generally positive returns. Momentum does not die easily.
Glittery
Optimism on gold has been ticking higher and is now above 60. During bear markets, optimism often peaks before getting much beyond 60 (during bull markets, it usually stays above 40). During gold’s bad 7-year stretch, when the Optimism Index was this high, its average return over the next month was -1.4% with only 28% of the days showing a positive return according to the Backtest Engine.
A little less strong
The McClellan Oscillator has ended its streak above 50 after 22 days. That was the longest streak in history. The only ones nearing it ended after 19 days on 1962-11-30 and 1966-11-11.