Wolf Richter wolfstreet.com, www.amazon.com/author/wolfrichter
House prices down $265,000 from peak, down $60,000 from year ago. America’s most majestic housing bubble begins to deflate.
In San Francisco, the median price of single-family house sales that closed in November fell to $1.435 million. This is down a blistering $265,000 or 15.5% from the crazy peak in February of $1.7 million – a time when only the sky was the limit. And down by $60,000 from November 2017. This puts the median house price below where it had first been in May 2017. Note the steep slope from the peak in February:
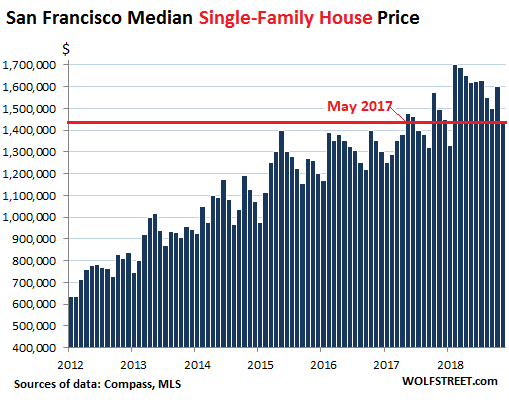
Median price means half of the homes sold for more, half sold for less. So on the bottom end, people can try to push their luck with an occasional small shack in the $800,000 range. All data via Patrick Carlisle, Chief Market Analyst at Compass.
About 53% of total sales in San Francisco were condos; for years, all new housing construction has been condos and apartments, with practically no single-family houses being built, resulting in ever greater population density – and an increasing share of condos in the sales mix.
The median price of condos whose sales closed in November dropped to $1.2 million (also includes the few sales in TIC or Tenancy in Common buildings). While that still sounds like a ludicrously huge amount for a median condo – something like a small-ish two bedroom without anything spectacular – the price is down $50,000 from the peak in March, April, and May, and down $30,000 from November 2017:
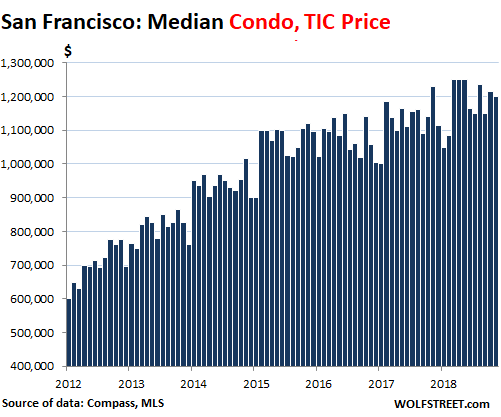
Data for condo sales represent actual sales that closed and were reported to the MLS (Multiple Listing Services) where brokers list properties. However, these sales do not include the sales of new-built condos that developers sell through their own sales offices. A lot of condos have been built recently, and a lot more are in the pipeline. But developers don’t list them with the MLS and don’t report sales and prices to the MLS.
The median price of all types of dwellings combined dropped to $1.31 million, down about $95,000 or 7% from the peak of $1.41 million in March, and down $14,000 from November last year:
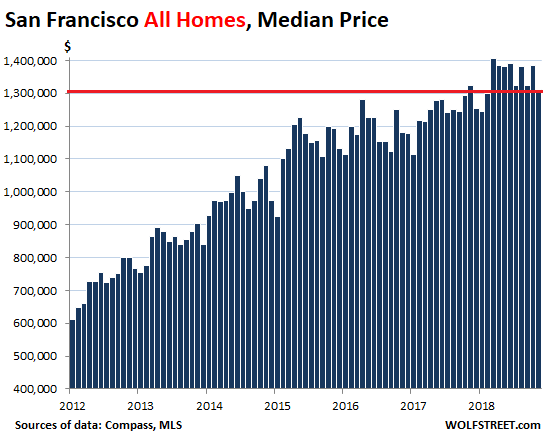
Clearly, the sky is not the limit for home prices in San Francisco, but the sky is not yet falling either. These are just relatively minor price declines in volatile data of one of the biggest real estate bubbles the US has ever seen.
Sales volume for all types of dwellings combined fell 14% in November, compared to a year ago, to 444 homes.
In San Francisco as well as the counties of San Mateo and Santa Clara, which make up Silicon Valley, the underlying dynamics of the housing market changed last summer and have since taken a more serious turn for the worse. These median selling prices show that the underlying dynamics have come to the surface.
A similar scenario played out in most other Bay Area counties, with only three still showing year-over-year increases in median prices, if modest ones; the other counties showing year-over-year declines (data via email from Patrick Carlisle at Compass):
- Santa Clara County (Silicon Valley): -1.6%
- San Mateo (Silicon Valley): +1.0%
- Marin County (north of the Golden Gate Bridge): -6.0%
- Sonoma County (north of Marin): -5.3%
- Alameda County (includes Berkley, Oakland, and a big part of the East Bay down to Santa Clara County): +2.3%
- Contra Costa Central (Lamorinda and Diablo Valley): -3.8%
- Napa County: +1.8%
But the Bay Area economy is still hopping, and companies are still hiring. The classic and inevitable tech bust that everyone who has been around here long enough is expecting hasn’t arrived yet. And this downturn in housing is taking off in a very strong local economy.
Homebuilder Toll Brothers just said it out loud. Read… Why California’s Housing Market is in for Serious Trouble