Santelli Exchange: Jim Grant on the markets from CNBC.
Margin Debt hits historical levels, watch this spread!
CLICK ON CHART TO ENLARGE
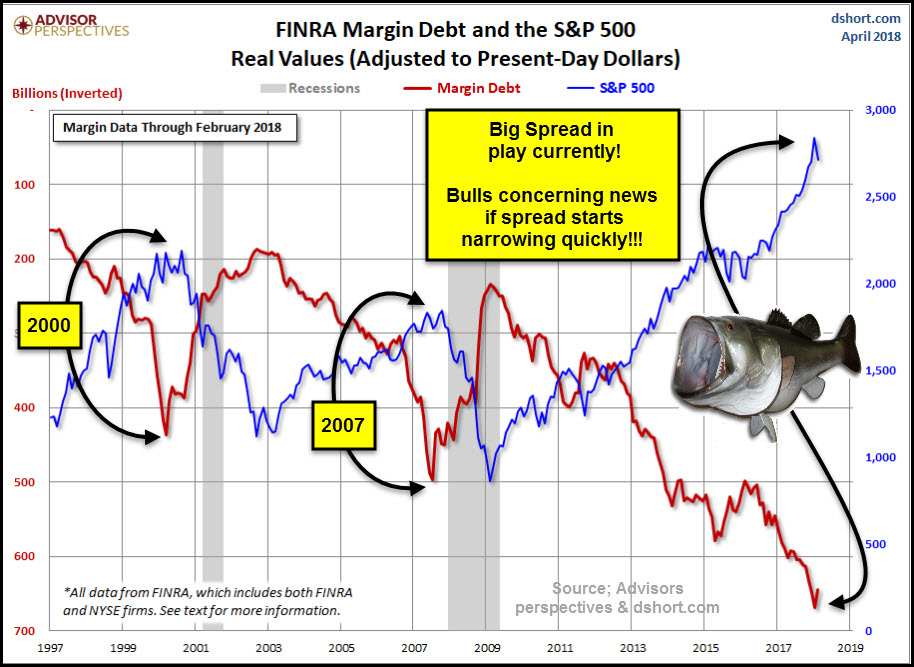
This chart from Advisors Perspectives/dshort.com looks at the S&P 500 and margin debt (inverted) over the past 20-years. When the spread was wide back in 2000 & 2007 and started narrowing (investors reducing margin exposure), stocks started to sell off.
This chart updates that the spread is now at historical levels. Should this spread start narrowing quickly, it would send a short-term caution message to stock market bulls.
Investors pulled a ‘remarkable’ $40 billion from U.S. stocks since mid-March
Investors pulled a “remarkable” $40 billion from U.S. equity market funds in the closing weeks of March, a new survey from the Institute of International Finance found.
The organization, which works with banks and financial institutions around the globe, said trade tensions, increased deficit spending by the United States and higher U.S. interest rates from the Federal Reserve may all have been factors in a swing in sentiment that caused investors to pull funds out of the market.
The exodus from U.S. funds weighed heavily on the global appetite for stocks, as world equities saw just $10 billion of inflows during the month. That came despite a record $45 billion of weekly funds flowing into stocks during the early part of the month.
Atlanta Fed GDP nowcast drops to 2.3% from 2.8% pic.twitter.com/bskQ39Rn4e
— zerohedge (@zerohedge) April 5, 2018
Global Services PMI: Down to Feb 17 lows pic.twitter.com/11XECTMQs5
— Don Draper (@DonDraperClone) April 5, 2018
Small Business Lending Index pic.twitter.com/dZVK8gpdZo
— Don Draper (@DonDraperClone) April 5, 2018