via CNBC:
One warning sign in housing market could spell trouble for economy from CNBC.
The U.S. economy is growing at a healthy pace, the labor market is its tightest in years and consumer confidence hasn’t been this high since 2000.
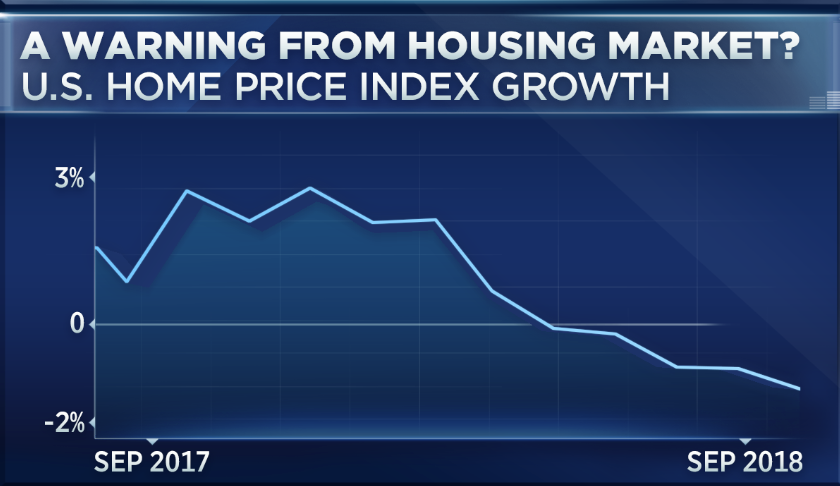
But one warning sign of trouble could be flashing in the housing market, according to forecaster Lakshman Achuthan.
“Our leading home price index has made a downturn that it hasn’t made in a long time,” Achuthan, co-founder of the Economic Cycle Research Institute, told CNBC’s “Trading Nation” on Wednesday. “The last time it was this weak … was in 2009 coming out of the last recession, and this leading index in 2006 really did call the housing bust.”
Homebuilding stocks are getting killed, plunging deeper into bear market territory. But nothing to worry about as this time it's different. The economy can boom even as the housing and auto markets bust. Plus rising interest rates will have no impact on an overleveraged economy.
— Peter Schiff (@PeterSchiff) October 4, 2018
Even Wall Street Cheerleader Confesses—-Epic Meltdown Ahead
Wall Street veteran Sam Stovall is warning stock investors the longest bull market on record will end with an epic meltdown. According to the CFRA chief investment strategist, it’s a side effect of an unprecedented business cycle.
“Three conditions: Very long, very high, very expensive,” Stovall said Tuesday on CNBC’s “Futures Now.” “History would imply that be careful because now we’re likely to fall into a very deep bear market when it does finally hit with the average decline being close to 40 percent plus.”
Home Construction suggesting stock market peak is near?
Interest rates are steadily creeping higher. And housing, as measured by the several housing related ETFs and Indexes is facing a slowdown. And not very many people are talking about it. Well, it’s time to put it on your radar!
Housing carries implications for the economy and the stock market (and our portfolios).
Currently, the Home Construction Index and ETF (NYSEARCA: ITB) have turned lower. The Homebuilders ETF (NYSEARCA: XHB) has turned down. And the broad Real Estate ETF (NYSEARCA: IYR) has been chopping sideways.
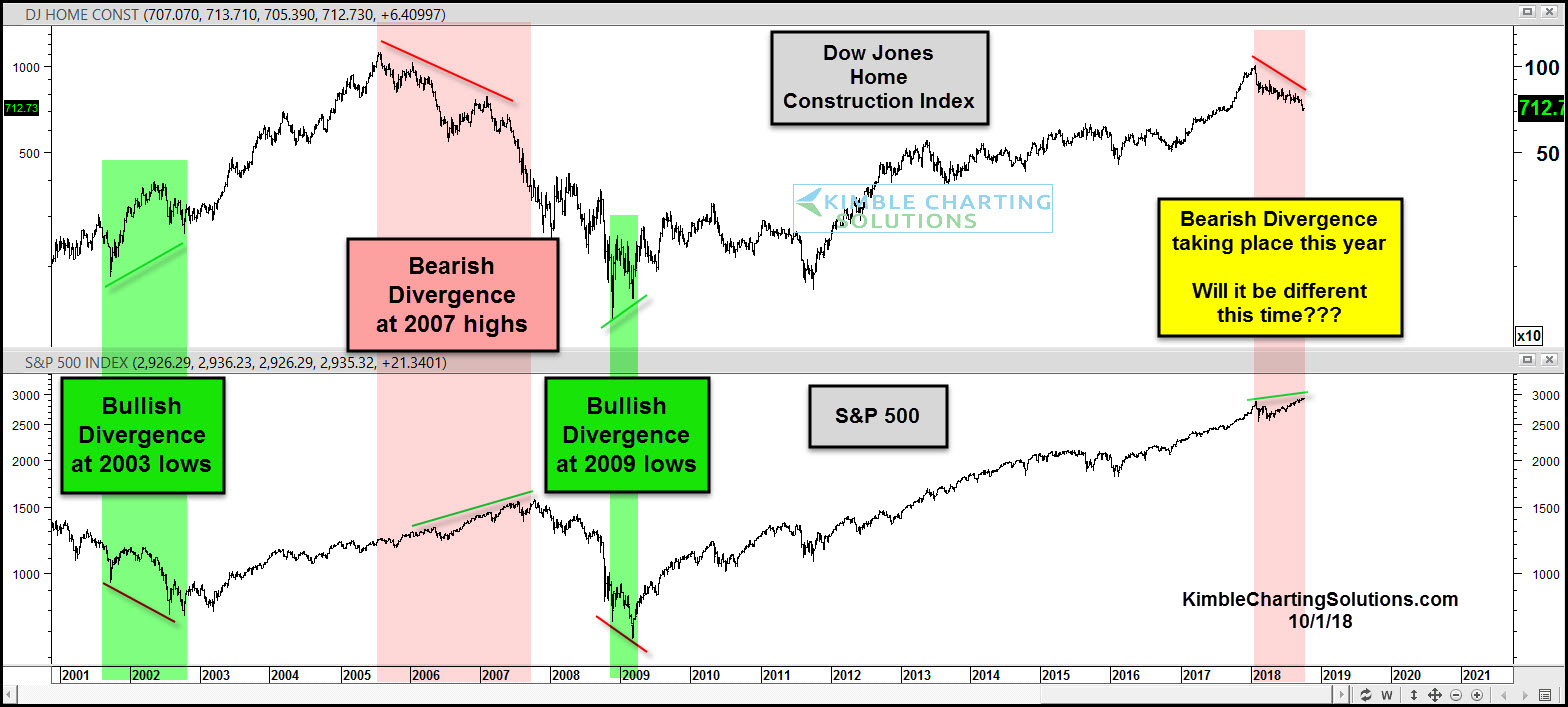
Looking at the chart below, we can see the relationship between housing and the stock market. Major divergences have formed at the last three big turns for the S&P 500.
In 2001/2002 and in 2008/2009, the Dow Jones Home Construction Index began to improve prior to the S&P lows. In mid-2005, the Index turned lower, prior to the 2007 stock market top. And once again we are seeing the Home Construction Index turning down while the S&P 500 is higher.
When will this divergence matter to the equity markets? Will it be different this time?
Dow Jones Home Construction Index vs S&P 500
CLICK ON CHART TO ENLARGE