“Actually, one of the dangers is that people could be throwing risk to the wind and this [market] could be a runaway. We sometimes call that a melt-up and produces prices too high and then if there’s a shock, you come down to Earth and that could impact sentiment. I think this market is fully valued and not undervalued, but I don’t think it’s overvalued,” – Jeremy Siegel
Here is an interesting thing.
“Market bubbles have NOTHING to do with valuations or fundamentals.”
Hold on…don’t start screaming “heretic,” and building gallows just yet.
Let me explain.
I can’t entirely agree with Siegel on the market being “fairly valued.” As shown in the chart below, the S&P 500 is currently trading nearly 90% above its long-term median, which is expensive from a historical perspective.
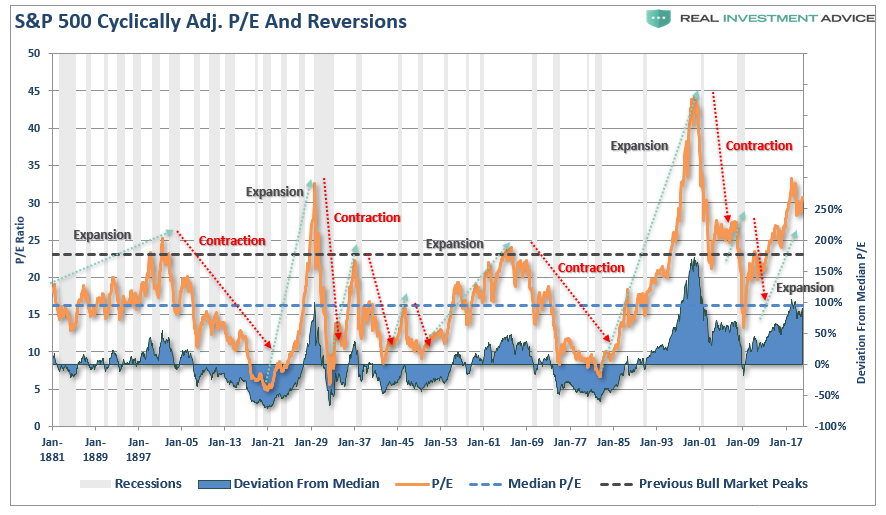
However, since stock market “bubbles” are a reflection of speculation, greed, emotional biases; valuations are only a reflection of those emotions.
In other words, bubbles can exist even at times when valuations and fundamentals might argue otherwise. Let me show you an elementary example of what I mean. The chart below is the long-term valuation of the S&P 500 going back to 1871.
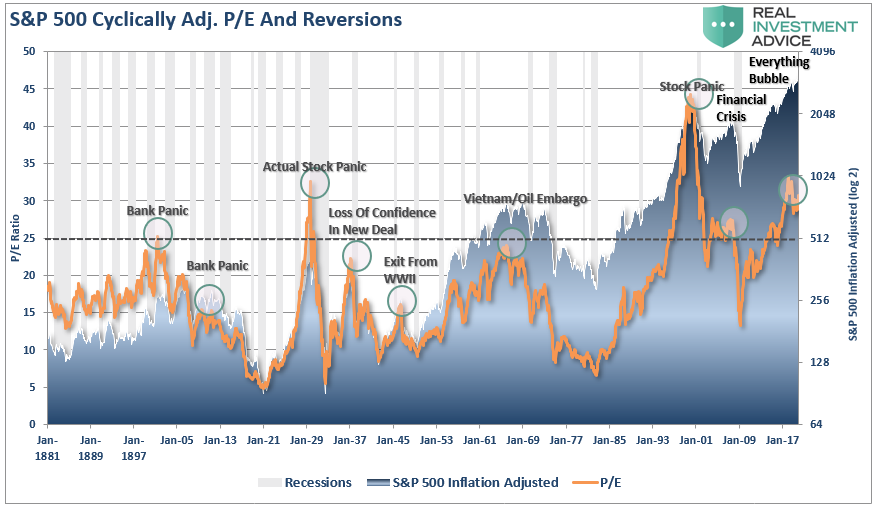
Notice that with the exception of only 1929, 2000, and 2007, every other major market crash occurred with valuations at levels LOWER than they are currently.
Secondly, all market crashes have been the result of things unrelated to valuation levels such as liquidity issues, government actions, monetary policy mistakes, recessions, or inflationary spikes. Those events were the catalyst, or trigger, that started the “reversion in sentiment” by investors.
For Every Buyer
You will commonly hear that “for every buyer, there must be a seller.”
This is a true statement. The issue becomes at “what price.” What moves prices up and down, in a normal market environment, is the price level at which a buyer and seller complete a transaction.
Market crashes are an “emotionally” driven imbalance in supply and demand.
In a market crash, the number of people wanting to “sell” vastly overwhelms the number of people willing to “buy.” It is at these moments that prices drop precipitously as “sellers” drop the levels at which they are willing to dump their shares in a desperate attempt to find a “buyer.” This has nothing to do with fundamentals. It is strictly an emotional panic, which is ultimately reflected by a sharp devaluation in market fundamentals.
Bob Bronson once penned:
“It can be most reasonably assumed that markets are sufficient enough that every bubble is significantly different than the previous one, and even all earlier bubbles. In fact, it’s to be expected that a new bubble will always be different than the previous one(s) since investors will only bid up prices to extreme overvaluation levels if they are sure it is not repeating what led to the last, or previous bubbles. Comparing the current extreme overvaluation to the dotcom is intellectually silly.
I would argue that when comparisons to previous bubbles become most popular – like now – it’s a reliable timing marker of the top in a current bubble. As an analogy, no matter how thoroughly a fatal car crash is studied, there will still be other fatal car crashes in the future, even if the previous accident-causing mistakes are avoided.”
Comparing the current market to any previous period in the market is rather pointless. The current market is not like 1995, 1999, or 2007? Valuations, economics, drivers, etc. are all different from cycle to the next. Most importantly, however, the financial markets adapt to the cause of the previous “fatal crashes,” but that adaptation won’t prevent the next one.
It’s All Relative
Last week, in our MacroView, I touched on George Soros’ theory on bubbles, which is worth expanding a bit on in the context of this article.
“Financial markets, far from accurately reflecting all the available knowledge, always provide a distorted view of reality. The degree of distortion may vary from time to time. Sometimes it’s quite insignificant, at other times it is quite pronounced. When there is a significant divergence between market prices and the underlying reality, the markets are far from equilibrium conditions.
Every bubble has two components:
- An underlying trend that prevails in reality, and;
- A misconception relating to that trend.
When positive feedback develops between the trend and the misconception, a boom-bust process is set into motion. The process is liable to be tested by negative feedback along the way, and if it is strong enough to survive these tests, both the trend and the misconception will be reinforced. Eventually, market expectations become so far removed from reality that people are forced to recognize that a misconception is involved. A twilight period ensues during which doubts grow, and more people lose faith, but the prevailing trend is sustained by inertia.
As Chuck Prince, former head of Citigroup, said, ‘As long as the music is playing, you’ve got to get up and dance. We are still dancing.’ Eventually, a tipping point is reached when the trend is reversed; it then becomes self-reinforcing in the opposite direction.”
Typically bubbles have an asymmetric shape. The boom is long and slow to start. It accelerates gradually until it flattens out again during the twilight period. The bust is short and steep because it involves the forced liquidation of unsound positions.
The chart below is an example of asymmetric bubbles.
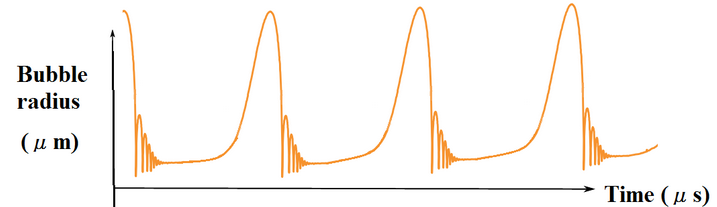
The pattern of bubbles is interesting because it changes the argument from a fundamental view to a technical view. Prices reflect the psychology of the market, which can create a feedback loop between the markets and fundamentals.
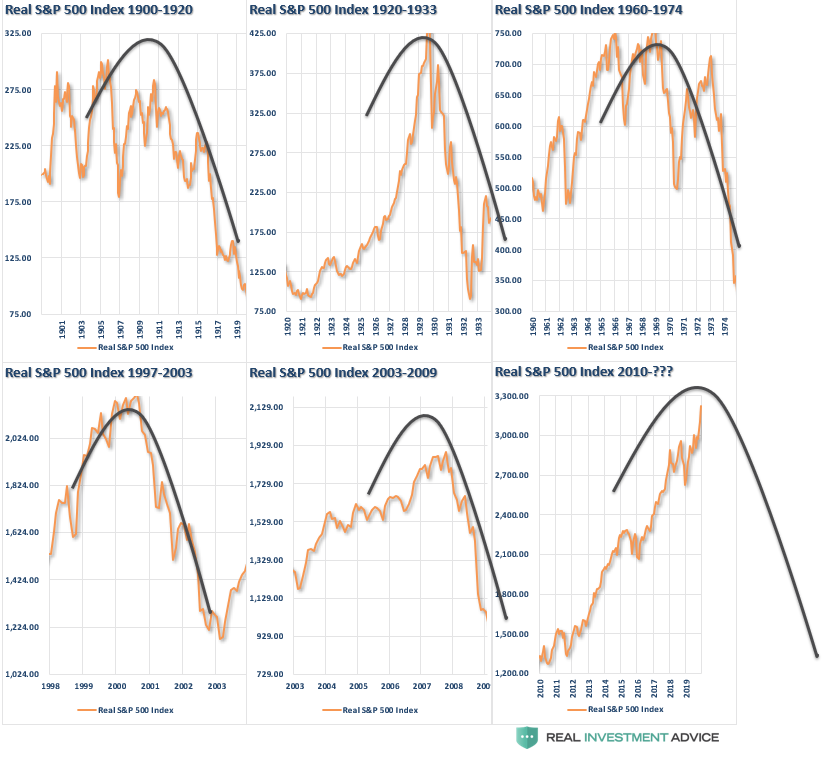
This pattern of bubbles can be seen at every bull market peak in history. The chart below utilizes Dr. Robert Shiller’s stock market data going back to 1900 on an inflation-adjusted basis with an overlay of the asymmetrical bubble shape.
As Soro’s went on to state:
“Financial markets do not play a purely passive role; they can also affect the so-called fundamentals they are supposed to reflect. These two functions, that financial markets perform, work in opposite directions.
- In the passive or cognitive function, the fundamentals are supposed to determine market prices.
- In the active or manipulative function market, prices find ways of influencing the fundamentals.
When both functions operate at the same time, they interfere with each other. The supposedly independent variable of one function is the dependent variable of the other, so that neither function has a truly independent variable. As a result, neither market prices nor the underlying reality is fully determined. Both suffer from an element of uncertainty that cannot be quantified.”
Currently, there is a strong belief the financial markets are not in a bubble, and the arguments supporting that belief are based on comparisons to past market bubbles.
It is likely that in a world where there is virtually “no fear” of a market correction, an overwhelming sense of “urgency” to be invested, and a continual drone of “bullish chatter;” the markets are poised for the unexpected, unanticipated, and inevitable event.
Reflections
When thinking about excess, it is easy to see the reflections of excess in various places. Not just in asset prices but also in “stuff.” All financial assets are just claims on real wealth, not actual wealth itself. A pile of money has use and utility because you can buy stuff with it. But real wealth is the “stuff” — food, clothes, land, oil, and so forth. If you couldn’t buy anything with your money/stocks/bonds, their worth would revert to the value of the paper they’re printed on (if you’re lucky enough to hold an actual certificate).
But trouble begins when the system gets seriously out of whack.
“GDP” is a measure of the number of goods and services available and financial asset prices represent the claims (it’s not a very accurate measure of real wealth, but it’s the best one we’ve got.) Notice the divergence of asset prices from GDP as excesses develop.
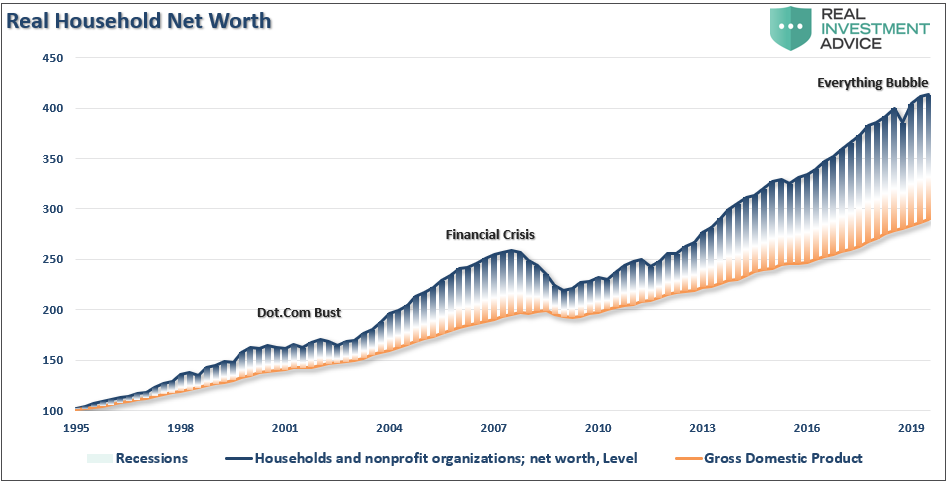
What we see is that the claims on the economy should, quite intuitively, track the economy itself. Excesses occur whenever the claims on the economy, the so-called financial assets (stocks, bonds, and derivatives), get too far ahead of the economy itself.
This is a very important point.
“The claims on the economy are just that: claims. They are not the economy itself!”
Take a step back from the media, and Wall Street commentary, for a moment and make an honest assessment of the financial markets today.
The increase in speculative risks, combined with excess leverage, leave the markets vulnerable to a sizable correction at some point in the future. The only missing ingredient for such a correction is the catalyst to bring “fear” into an overly complacent marketplace.
It is all reminiscent of the market peak of 1929 when Dr. Irving Fisher uttered his now famous words: “Stocks have now reached a permanently high plateau.”
This “time IS different.”
However, “this time” is only different from the standpoint the variables are not exactly the same as they have been previously. The variables never are, but the outcome is always the same.