Wolf Richter wolfstreet.com, www.amazon.com/author/wolfrichter
Stock-market bubbles don’t end well for those who don’t get out in time.
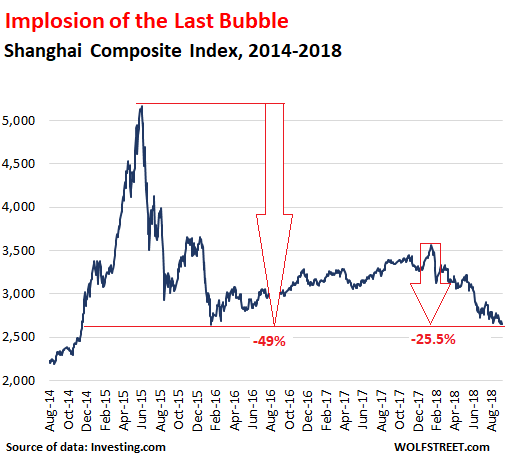
US tariffs and threats of more tariffs have not been particularly well received in China, which is already being rattled by corporate credit problems, quakes in the shadow banking system, a peculiar Enron-type phenomenon at provincial and municipal governments called “hidden debt,” and the implosion of nearly 5,000 P2P lenders that have sprung up since 2015. And so today, the Shanghai Composite Index dropped 1.1% to 2,651.79.
This is a big milestone:
- Below the low of its last collapse on January 28, 2016 (2,655.66)
- Down 25.5% from its recent peak on January 24, 2018, (3,559.47)
- Down 49% from its bubble peak on June 12, 2015 (5,166)
- Down 56% from its bubble peak on October 16, 2007 (6,092)
- Below where it had been for the first time on December 29, 2006 (2,675), nearly 12 years ago. That’s quite an accomplishment.
This chart of the Shanghai Stock Exchange Composite Index shows the last bubble in Chinese stocks. Note the rise from the last low in January 2016. This rise has been endlessly touted in the US as the next big opportunity to lure US investors into the Chinese market, only to get crushed again:
But what makes Chinese stocks interesting is not the collapse of one bubble and then the collapse of the subsequent recovery, but the longer view that is now taking on Japanese proportions.
The chart below shows the double-bubble and the double-collapse, interspersed with collapsed recoveries and failed excitement:
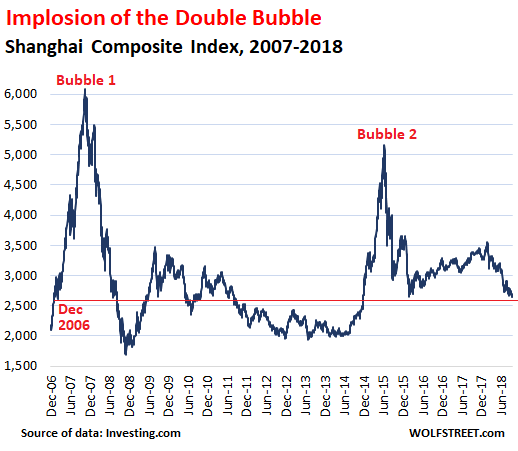
It is not often that a major stock market goes through two majestic bubbles and then revisits levels first seen 12 years earlier – despite inflation in the currency in which these stocks are denominated.
This whole procedure is somewhat reminiscent of the procedure Japanese stocks went through. The Nikkei 225 Index hit an all-time high on December 29, 1989, of 38,957 intraday, after having surged six-fold over the decade. This was part of a general asset-price bubble, including real estate, at a time when the idea was touted in the US that Japanese companies and banks, with their special and superior way of being run, would take over, or at least buy, the world.
The Nikkei eventually plunged to 7,054 by March 2009. Today, it closed at 23,094, down 40% from its peak nearly 30 years ago. Who knows where it would be if the Bank of Japan hadn’t stepped in to become the largest buyer of Japanese equities and the largest stock-market manipulator, as official part of its QQE program.
Bubbles are great fun on the way up. But when they implode, which they always do, they have a way of doing long-term damage.
By comparison, the US stock market is now in its third bubble since the 1990s – and this one is more magnificent than the prior ones, and it’s not just stocks but most other asset classes, and there is the hope that this Everything Bubble will go on forever, just like there was that kind of hope in China in 2015 and 2007, and in Japan in 1989.