Stock market uncertainty is rising on the heels of an 800-point plunge in the Dow yesterday. In this six-minute video, Mike explores the simple ratio that demonstrates the extreme overvaluation in stocks today and how far they still have to fall to reach anything resembling fair value.
Mike Maloney’s Stock Fragility Index Is Screaming “Bubble”
A funny thing happened in the middle of one of Mike Maloney’s deep-research sessions recently. As you know, he just released a brand new presentation, but while analyzing the stock market he wasn’t satisfied with the way most valuation measures were calculated. With all due respect to Warren Buffet, even his indicator fell short in Mike’s view. It was time for something new, something more insightful, something more accurate.
Mike’s refusal to settle for “good enough” culminated in his own metric: the Market Fragility Index. Here’s your peek into this brand new economic indicator, found in Part II of his 5-part Early Warning Report…
The Warren Buffet Indicator
Warren Buffett, probably the most successful investor of modern times, came up with his own indicator to tell him if the stock market was overvalued or undervalued. He compares the size of the stock market to GDP, the premise being that the US stock market should not be bigger than the country’s annual economic output. If it is, the market is overvalued. If it’s smaller than GDP, it is, by varying degrees, undervalued.
The formula is simple: divide total US stock market capitalization by GDP. If the reading is greater than one, the stock market is overvalued relative to economic output. If it’s less than one, the market is undervalued.
From Mike’s presentation, you can see where the Buffett Indicator says we are today:

Right now, the stock market is 40% larger than the US economy. It’s the second-highest reading since 1947. In other words, Buffett’s own indicator says stocks are very overvalued.
But does this necessarily mean stocks will stop going up tomorrow? Just how fragile or vulnerable is the market at this point?
To get a sense of that, we need to look at…
Margin Debt
Did you know you can ask your broker to buy stocks on margin? You must qualify, and it’s usually done more often by traders and institutions than individual investors, but it is essentially a way to gain leverage in the stock market, allowing you to buy more stock while putting up less of your own money than typically required.
For example, you put down 20% of the cash for a stock you want to buy, and your brokerage house puts up the other 80%. You keep the full gain of the stock’s rise (after brokerage fees) without investing the full amount upfront. This gives you 5-to-1 leverage — if the stock goes up 10%, you make 50%!
As you probably know, though, leverage works both ways. If the stock falls 10%, you lose 50%.
As you can probably surmise, the greater the level of margin debt, the more fragile the system is.
Well, margin debt is currently at the highest level in history:

With margin debt at all-time highs, the stock market is highly vulnerable to a crash. Once stocks begin to decline, whether it happens slowly or quickly, more and more investors will be forced to sell, or worse get a “margin call” where they must either deposit more money in the account or sell some of their investments, which would further exacerbate the selloff.
Don’t have the cash to offset your margin losses? Here’s the really nasty thing about margin: Your brokerage can and will sell your losing positions without consulting you first in order to make sure your account stays liquid enough that they get their loaned capital back. Ouch.
And that brings us to Mike’s new indicator…
The Market Fragility Index
The Buffett Indicator falls short because it strictly measures stock market valuation relative to economic growth. But just because an equation may tell us something is overvalued, it doesn’t necessarily tell us how vulnerable it may be to imminent collapse.
Mike combines the Buffet Indicator with margin debt to create the Market Fragility Index. It is a new metric you won’t find anywhere else. It combines two crucial, telling inputs to measure both the magnitude and tenuousness of today’s stock market bubble.
Using over a century of data, here’s what it shows today:
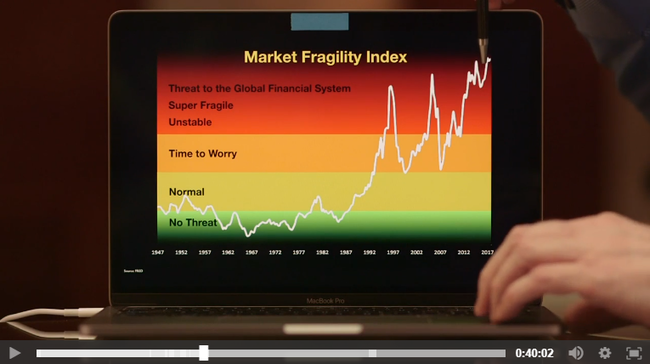
As you can see, Mike’s indicator shows the stock market is now so high that it is a “threat to the global financial system.” Every time this indicator got this high in the past we experienced a severe financial, economic, or monetary crisis. And we’re now at the highest reading it has ever registered.
In other words, the stock market is more fragile now than at any time in history. It’s not just top-heavy; the combined amount of leverage and lofty valuations we have today exceed even those of 1929.
There are serious implications to the stock market being this vulnerable. Mike discusses some of them in his presentation, and more importantly shows in Parts 4 and 5 how to not just protect yourself, but profit from what is to come. He also reveals his personal investments, and how he is positioning himself for the inevitable crash in the stock market.
Get Mike Maloney’s biggest update in years, along with his personal holdings (and allocations to each), by watching hisEarly Warning Report.