by Doug Kass

* A broad market top may be forming now
* My blueprint remains the same… I plan to sell into strength
* Yell and roar and sell some more
“Life is really simple, but we insist on making it complicated.”
I would also take my cue from the Portfolio Insurance induced drop in October, 1987, below — after all, like the action of the last few days the 1987 crash was also a liquidity event:
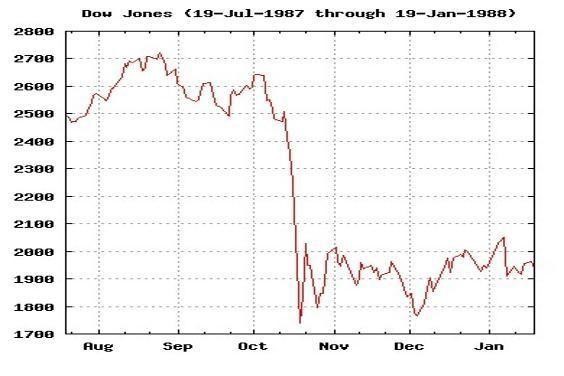
As you can see in the 1987 chart, that template produced a Monday obliteration which was followed, like today, by a “Turnaround Tuesday.” That sharp rally continued for only a day or two. But soon thereafter, two tests of the bottom occurred. First, a week later and, again in early December.
I would not be surprised if that pattern is repeated in the next few weeks.”
– Kass Diary, “My Blueprint Remains The Same“
History Rhymes
So far the October, 1987/February, 2018 analog is holding up.
Similar to October, 1987, the S&P Index has experienced a +9% rally (from 2540 to 2785) the capitulation lows of several Fridays ago (this compares to the initial thrust of +14% in the first October, 1987 rally).
As was the case 32 years ago we then had a retest (to 2645) late last week (bouncing off the 100-day moving average) and, adjusted for the futures rise this morning, to about 2730 – basically in line with my 2725-2750 target I expressed three days ago.
If history rhymes (see chart of October-December, 1987 above), stocks will meander for several weeks (perhaps with a slightly declining bias) and, in several weeks, will make another retest of the lows.
Accordingly, I plan to expand my short book into the current rally.
Looking Beyond Our Noses…
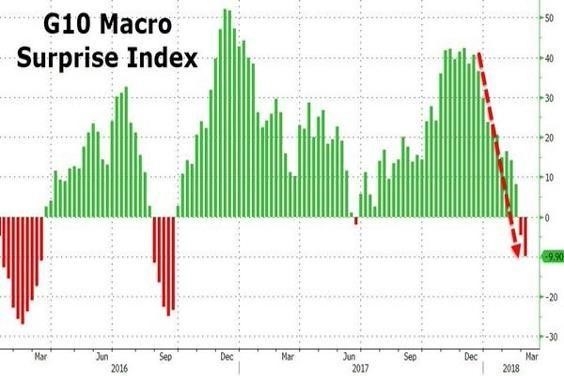
Source: Zero Hedge
Unlike in December, 1987, I dont expect the markets to take off in 2018 — just the opposite. As I wrote in my closer,“A Maturing Bull Market”:
“I wanted to observe that my highest probability outcome is that the S&P Index is making a broad top now.
The tremor was possibly seen in early February but the quake may lie ahead.
While this view wont surprise many — it is in marked contrast to what I am hearing in the business media and from leading strategists.
Above all, as expressed earlier today in my Diary, the possibility of policy errors is multiplying (policy process in Washington, DC is broken, incoherent and done “on the fly”) — at a time in which the core fundamentals of the global economies are still not as secure as the consensus believes (see chart above), central bankers are pivoting and when valuations are elevate.”
In terms of the intermediate term I am basically on board with Goldman Sach’s technical analysis team’s thinking (H/T Zero Hedge):
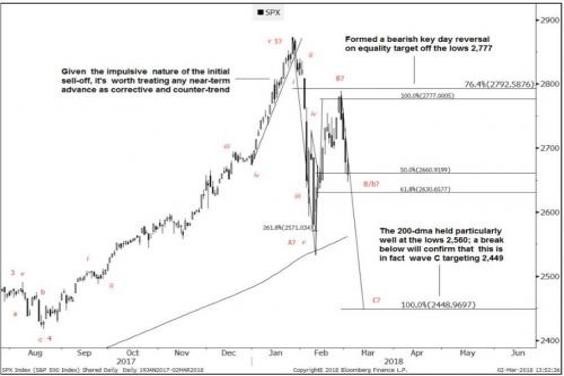
“The index saw an initial selloff that was impulsive in nature (wave A). This tends to mean that there’s likely going to be another impulsive 5-wave decline to complete an ABC 5-3-5 count. From current levels, an eventual C wave could reach somewhere close to 2,449.
Having said that, it’s not uncommon for wave B to form complex structures (often triangles). Although ultimately bearish, there’s scope for some initial consolidation/range-bound price action while still in the “body” of the February range.
The next significant retrace level below is 61.8% from Feb. 9th at 2,631. The 200-dma will likely be critical at 2,560. This particular moving average held very well at the prior low. Getting a break below it would therefore help to confirm that this is in fact wave C targeting at least ~2,449.”
Goldman sees overlapping price action in between 2,600 and 2,800. A break below the 200-dma will open up for a minimum target down to 2,449.
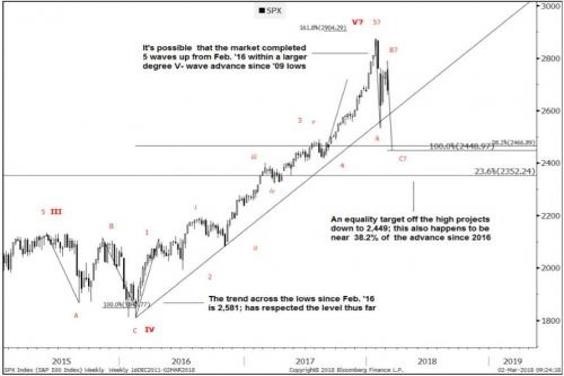
“Reaching this 2,449 level would also mean retracing ~38.2% of the immediate advance from Feb. ’16 (2,467). This would therefore be an ideal target from a classic wave count perspective; that is, if correcting the rally from Feb. ’16.
As has been discussed in previous updates, the market could also be starting a much bigger/more structurally corrective process, counter to a V wave sequence from the ’09 lows. If that’s the case, there should be room to continue a lot further over time. At least 23.6% of the rally since ’09 which is down at 2,352.
… it’s worth considering the possibility of continuing further than 2,467-2,449. Doing so might imply that this is not an ABC but rather a 1-2-3 of 5 waves down, in a larger degree ABC count that could take months to fully manifest. While it is still far too early to make this call, the important thing to note is that the 2,467-2,449 area will likely be trend-defining.”
Bottom Line
“At words poetic, I’m so pathetic
That I always have found it best,
Instead of getting ’em off my chest,
To let ’em rest unexpressed.
I hate parading my serenading
As I’ll probably miss a bar,
But if this ditty is not so pretty,
At least it’ll tell you how great you are.
You’re the top! You’re the Colosseum,
You’re the top! You’re the Louvre Museum,
You’re a melody from a symphony by Strauss,
You’re a Bendel bonnet, a Shakespeart sonnet,
You’re Mickey Mouse…
You’re the nose
On the great Durante
I’m just in a way
As the French would say, “de trop”
But if, baby, I’m the bottom
You’re the top!”
– Cole Porter, “You’re The Top”
My baseline expectation is that we may be seeing a broad market top forming in February-March that could be in place for some time and might morph into a more lengthy and deeper correction than the consensus expects.
Volatility — normally a vital feature of changing market complexion — seems likely to expand geometrically as liquidity has died in a market dominated by passive investing (ETFs) and risk parity and volatility targeting/trending products and strategies. The aforementioned are contributing to a market that is random, unpredictable and makes its “appearance” (over the short term) less real, more artificial and transitory — conditions that are ripe for opportunistic trading and intermediate term positioning for those that are impassioned and unemotional.
The tremor was felt in early February, the quake may lie ahead.
The rally has taken the S&P Index back into my 2725-2750 price target — I am a seller and, given the volatility, I plan to expand my net short exposure (on a scale higher). (I have added to my SPY short at $273.15 in premarket trading.)
For the intermediate term, I am on board with Goldman’s technical team who sees either a base or break of 2,467-2,449 support. (If the S&P breaks these levels Goldman sees a more lengthy and deeper corrective process lies ahead.)
Yell and roar and sell some more!
Doug Kass
Since 2004 Doug Kass has served as President of Seabreeze Partners Management, Inc. He runs a hedge fund and individual managed accounts, co-authored “Citibank: The Ralph Nader Report” with Ralph Nader and the Center for the Study of Responsive Law in the 1970s and wrote “Doug Kass: A Life on the Street” two years ago (John Wiley). Since 2003 Mr. Kass served as a guest host on CNBC’s “Squawk Box” and has guest hosted Bloomberg’s “Market Surveillance” for the last five years. Along with Jim Cramer, Doug is the principal contributor to Real Money Pro.