Wolf Richter wolfstreet.com, www.amazon.com/author/wolfrichter
It was an ugly Monday and Tuesday followed by a Wednesday that at first look like a real bounce but ended with the indices giving up their gains. This was followed, mercifully, by Thursday when markets were closed, which was followed unmercifully by Friday, during which the whole schmear came unglued again.
The S&P 500 index dropped 0.7% on Friday to 2,632 and 3.8% for Thanksgiving week, though this week is usually – by calendar black-magic – a good week, according to the Wall Street Journal: During Thanksgiving weeks going back a decade, the S&P 500 rose on average 1.3%.
This leaves the S&P 500 index 1.5% in the hole year-to-date. It’s now back where it had first been on November 30, 2017:
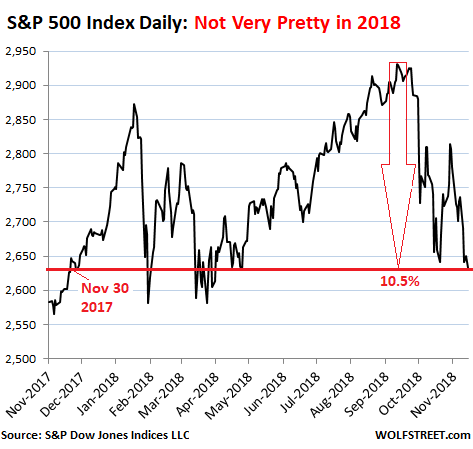
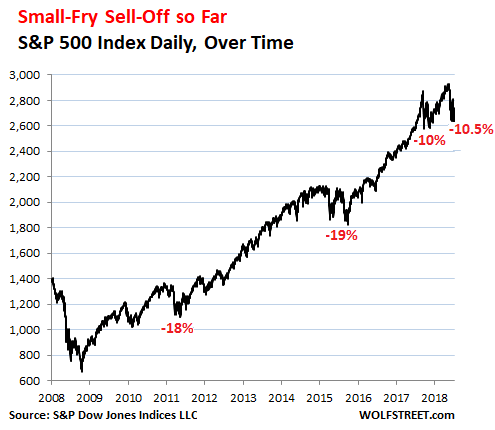
Clearly, when seen over the longer term, the sell-off for now still belongs to the small-fry among sell-offs, with S&P 500 down just 10.5% from its peak:
The Dow dropped 0.7% on Friday and 4.4% during Thanksgiving week, to 24,286. It’s 1.75% in the hole for the year. Technically speaking, it’s not even in a correction, being down only 9.9% from its peak.
And the Nasdaq, dropped 0.5% on Friday and 4.3% during Thanksgiving week. According to the Wall Street Journal, during Thanksgiving week over the past 20 years, the Nasdaq rose on average 1.3%. So this is no good for calendar-black-magic aficionados. Where’s the free-wheeling holiday spirit?
The Nasdaq is now down 14.7% from its peak at the end of August but remains up 0.5% year-to-date.
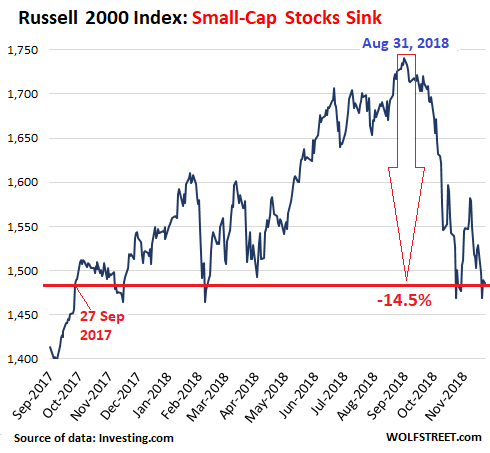
The Russell 2000 small-caps index edged down today and is down 14.5% from its peak on August 31. It’s 3% in the hole year-to-date and right back where it had first been on September 27, 2017:
These indices are unwinding little-by-little. And the fact that they’re barely in the red for the year, or in Nasdaq’s case still up a tiny bit, is a gruesome sight in November the likes of which a whole generation of stock market jockeys has never seen before and finds utterly outrageous.
They and their TV-personality allies – along with the professional crybabies on Wall Street – are already wailing and gnashing their teeth, and are clamoring for the Fed to reverse the rate hikes and stop the QE unwind to end this shocking and appalling phenomenon.
But there is considerable destruction going on beneath the surface, and investors who were overweighed these stocks are finding themselves with stiff losses – and if they were leveraged, may have already faced margin calls. Yesterday I covered the 438 stocks on the NYSE that have already plunged 40%-94% from their 52-week highs, including some very big names. Today, I’ll take a look at the biggest names on the Nasdaq.
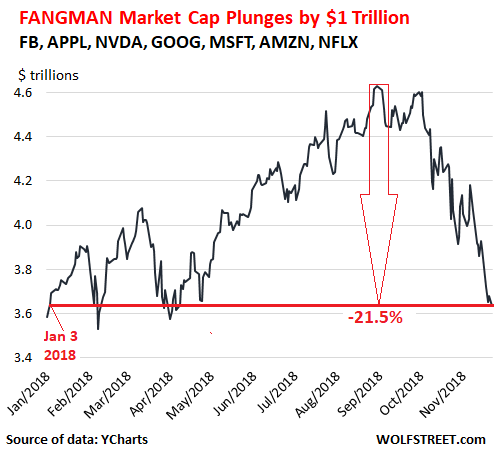
The seven FANGMAN stocks – Facebook, Amazon, Netflix, Google’s parent Alphabet, Microsoft, Apple, and NVIDIA – fell 1.3% on Friday in combined market cap. Over Thanksgiving week, they have now plunged 6.7%, or by $259 billion. Those are real dollars gone in four trading days with just seven stocks.
Since their combined market-cap peak of $4.63 trillion at the end of August, nearly $1 trillion — $994 billion to be precise – has dissolved into ambient air, as their combined market cap has plunged 21.5% in ca. 12 weeks:
But if you look at them as individual stocks, it’s even worse. The saving grace for the group as a whole was Microsoft, the second largest stock by market cap, which is threatening to become the largest stock shortly if Apple continues to fall at this pace. Three of the seven have already plunged by 38% to nearly 50%. Two more have plunged by 26% to 27%. Only two have dropped by less than 20%.
These are the market cap and percentage losses for each of the FANGMAN stocks from their respective peaks:
- Facebook [FB]: -$250 billion (-39.8%)
- Amazon [AMZN]: -$255.3 billion (-25.7%)
- Netflix [NFLX]: -$69.5 billion (-38.2%)
- Google [GOOG]: -$170.2 billion (-19.3%)
- Microsoft [MSFT]: -$92.5 billion (-10.5%)
- Apple [AAPL]: -$304 billion (-27.1%)
- NVIDIA [NVDA]: -$87.4 billion (-49.7%).
Added together, these price drops of each FANGMAN stock from its individual peak balloon to $1.23 trillion.
But even at these prices, the FANGMAN stocks are still vastly over-inflated. This is what you get after a huge run-up that lasted for so many years: There is a lot of air beneath them before prices make sense on a fundamental basis.
The pain is in some of the details beneath the surface. Overall nothing serious has happened yet. The S&P 500 has not yet unwound several years of gains. It’s working on unwinding one year of gains, and that’s as far has it has gotten at this point.
There is a large amount of money waiting in special funds to jump into the fray when the sell-off of particular shares or the market overall reaches certain levels. Get in, make a buck, get out. Dip buying is a huge thing, and will continue to be. It’s driven by humans and algos – and by companies buying back their own shares at strategic moments to push their prices back up. These dynamics will continue, sell-offs followed by dip-buying, followed by sell-offs that will “gradually” – as the Fed would likely say – wring the excesses out of the market, possibly for years to come, even as individual stocks, one after the other, get destroyed.