by Daniel Carter
The world has been here many times before. After several years of smooth economic sailing, prices have become exceedingly stretched to the upside and are destined to violently correct downward. Over the past two weeks, the S&P 500 has fallen over 7%. This has sparked the feeling in the investment community that the recent selloff may be the beginning of the end for this bull market. In this article, we’ll look at past economic cycles for some indication on how to profit from the nearing collapse in stock prices.
Signs Of A Top
There are many metrics that can signal a top in stock prices. These metrics are not perfect, especially when examining them individually. However, they become very useful when used together.
First, let’s look at interest rates. Before a recession or major market selloff, rates begin to surge. You can see from the chart below that interest rates spike before a recession more often than not. Rates then fall either during or after the recession (gray area). When rates rise, it becomes more difficult for consumers and businesses to pay off loans, resulting in a negative economic impact. Rates have been on an upward trend since August 2016 and have really surged over the past few weeks.

Stock market crashes also occur once full employment is reached in the economy. When the unemployment rate reaches a bottom, there is nowhere to go but up. The unemployment rate is highly susceptible to mean reversion, which is why it swings ferociously upward once it bottoms. We are very close to another bottom now.

Market tops are almost always preceded by extreme investor optimism. Investors become optimistic when prices rise, which leads them to invest more in the market, which leads to higher prices, which leads to even more optimism. This positive feedback loop will push stock prices to their limits. Instead of making wise investment decisions based on economic fundamentals, average investors pour money into the market hoping to get rich quick. When reality finally sets in, loses can come in a hurry. According to Hedge Fund Telemetry, bullish sentiment reached its highest level since the peak of the dot com bubble before the selloff began two weeks ago.
#HBDARRahman #nifty #banknifty #Bangalore #Chennai #Hyderabad$SPX bullish sentiment today reached 95% bulls… the highest reading since 1999. $NDX is at 94% and Nikkei is at 92%. Sentiment is updated on Hedge Fund Telemetry site for subscribers, too much optimistic
Fwd post
— Nifty Team Bangalore (@NiftyTeam1) January 6, 2018
With all the market euphoria going on, valuations have become steep as well. This has been typical before each of the most prominent market crashes in history. According to most valuation metrics, stocks have only been more overvalued during the peak of the dot com bubble. Below is one of the most common valuation metrics, which shows just how expensive the stock market has become.

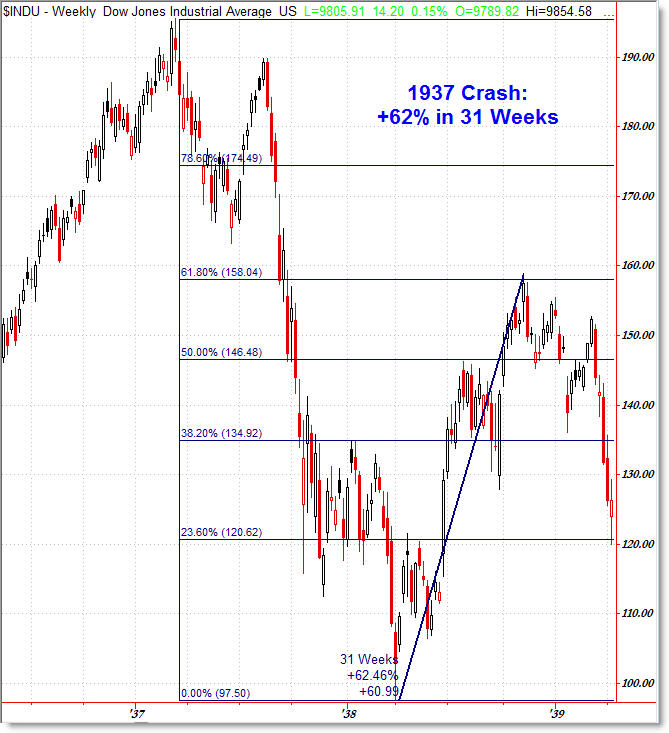
Previous Crashes
Our economy has always been a series of booms and busts. When examining large time frames, we will notice that recessions and stock market crashes are quite common. Since 1900, a recession has occurred about every six years on average. With the current expansion going on 10 years, we are way overdue for another crash. Let’s look at some of the most memorable crashes of the past and see what they might tell us about today’s market conditions.