via @Callum_Thomas
As the Fed is steadily progressing through its balance sheet normalization plan, it’s worth checking in on a few charts that highlight the path to normalcy…
And some of the potential stumbling blocks along the way.
The beginning of large scale asset purchases (or QE – Quantitative Easing) in the wake of the financial crisis was a grand monetary policy experiment, and we are now entering into another grand monetary policy experiment.
The key takeaways on quantitative tightening (or QT) are:
- QT is set to rise from a current potential $30B per month to $50B in Q4 this year.
- All else equal QT is likely to be a headwind for both stocks and bonds.
- Globally the ECB and BOJ are providing some offset, but will each be heading for the exits at some point too.
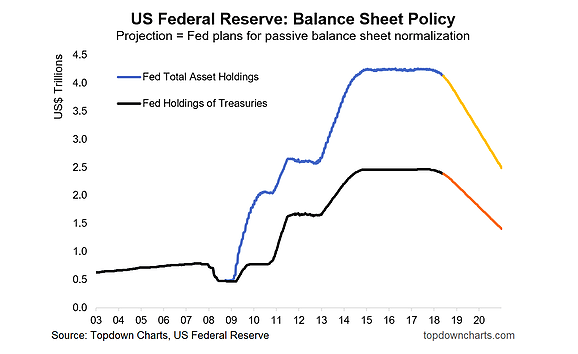
1. Fed Balance Sheet Normalization Plan
As outlined in the Fed’s plan for balance sheet normalization, the Fed has embarked on a progressive quantitative tightening program whereby it will allow its balance sheet to be run down over time. The chart below shows approximately how this will play out. Currently the total monthly pace of Quantitative Tightening is a potential $18B in treasuries and $12B for asset backed securities (combined $30B), all going to plan, this will rise to $30B in treasuries and $20B in ABS (combined $50B) in Q4 this year. For context, at its height QE3 was running at a pace of $85B per month
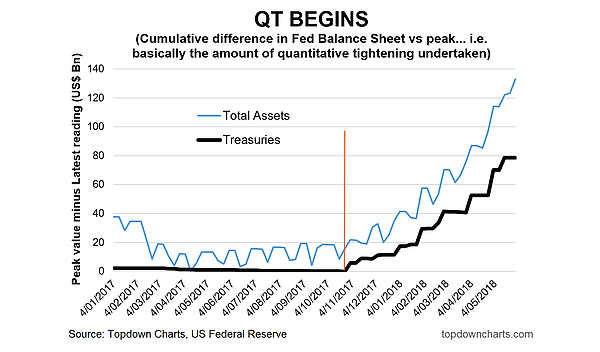
2. Cumulative Amount of Quantitative Tightening (QT) Undertaken
Since commencing Quantitative Tightening total assets have been reduced by over $120B and of that holdings of treasuries have been reduced by $80B in total. Thinking about this chart and the previous chart, and traditional policy tool of the Fed funds rate, I can’t help but wonder if there may be a “neutral level of the balance sheet”, just like there is the concept of a neutral Fed funds rate…
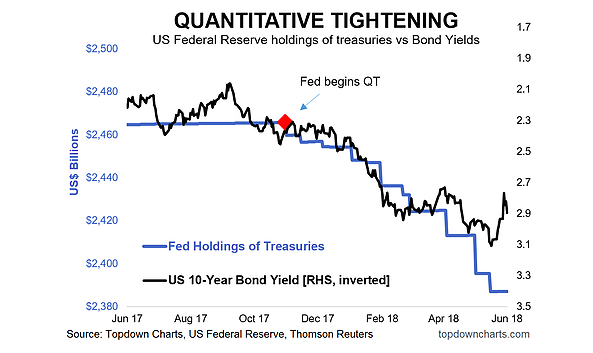
3. Quantitative Tightening vs Bond Yields
The commencement of QT coincided with the start of a reasonably sizable move in US 10-year bond yields. There are of course many factors that come in to play for bond yields (namely inflation, economic growth, etc), but from a flows standpoint less reinvestment means less purchases, and balance sheet rundown means less holdings locked out of the market on the Fed’s balance sheet. So all else equal, Quantitative Tightening should drive yields up at the margin.
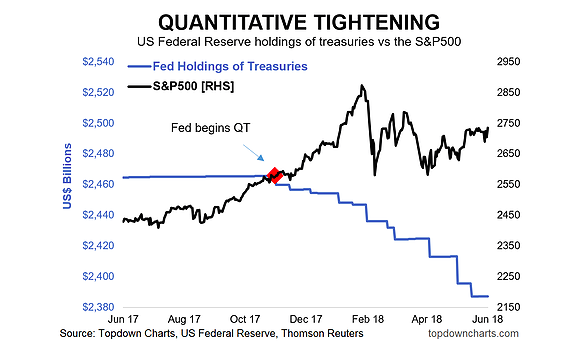
4. QT vs the S&P 500
Depending who you ask, QE had either little impact or major impact in driving stocks higher over the past 10 years, and if QE was helpful, then it stands to reason that QT will be harmful. As the pace of QT steps up through this year, the S&P 500 could end up on the receiving end of the completion of this grand monetary policy experiment as the Fed comes full circle.
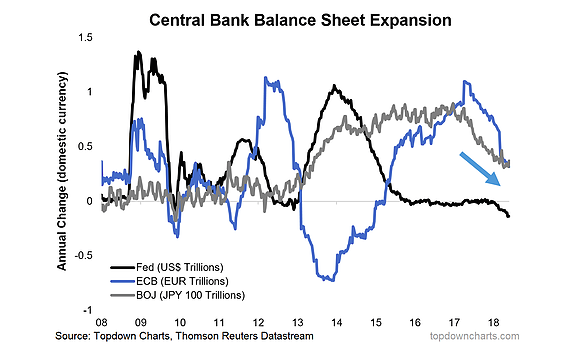
5. Global Central Bank Balance Sheet Expansion
Finally, for some global context, the major QE banks (The Fed, ECB, and BOJ), are actually all headed in the same direction. Although its worth noting that with Europe and Japan the balance sheets are still very much expanding, but just at a slower pace. For now this is providing some offset against Fed Quantitative Tightening, but the question is for how long…
Twitter: @Callum_Thomas
Any opinions expressed herein are solely those of the author, and do not in any way represent the views or opinions of any other person or entity.