by howmuch
They say only two things in life are absolutely certain: death and taxes. With Tax Day just around the corner, many Americans are gathering paperwork and getting ready to file their 2017 taxes. Federal and state income taxes represent just part of an individual’s total tax burden, however. Our new visualization illustrates how the state you live in determines the relative tax burden between federal, state, gas, sales, and property taxes.
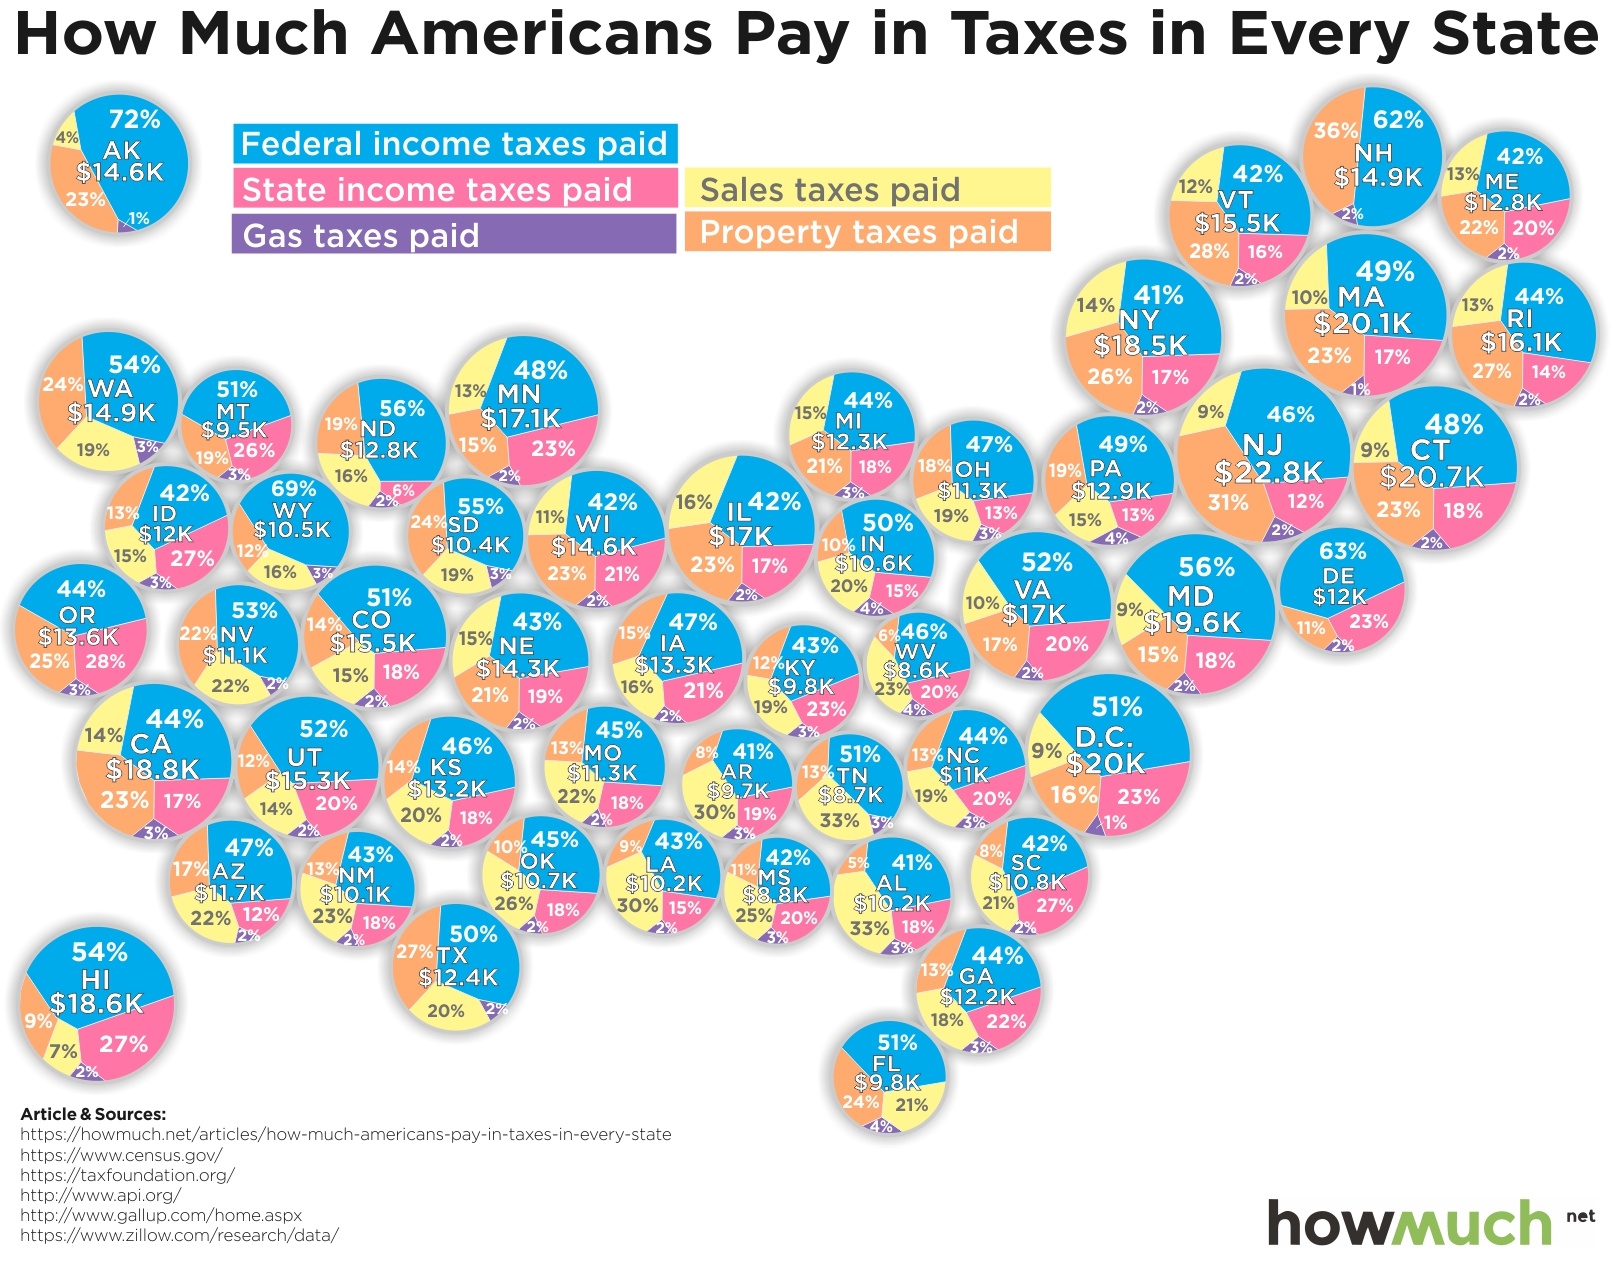
We compiled the data from GoBankingRates, which analyzed a few different sources to figure out the average tax burdens for each state. These included the 2016 Census Bureau American Community Survey for median household income levels, Zillow’s median home value and property tax information, the American Petroleum Institute’s average gas consumption figures, the Tax Foundation’s numbers of state sales tax rates, and Gallup’s estimates for average daily spending. We sliced and diced all this data to represent each state as a pie chart where each piece corresponds to the weight of each category of taxation. We then sized each pie chart based on the total taxes paid.
Top Five States with the Lowest Total Tax Burdens
1. West Virginia: $6,837
2. Montana: $7,035
3. Mississippi: $7,086
4. Kentucky: $7,537
5. Arkansas: $7,858
Top Five States with the Highest Total Tax Burdens
1. New Jersey: $22,829
2. Connecticut: $20,714
3. Massachusetts: $20,115
4. Washington, DC: $20,033
5. Maryland: $19,615
We can learn a lot about the economy and the American political system by analyzing our visualization. First off, the Northeast has several states with tax burdens far higher than those in the rest of the country. People in New Jersey pay more than 3 times as much in total taxes as their counterparts in West Virginia. There are a few different explanations for these enormous differences in tax levels, the most obvious being that some states don’t collect any income tax (like Tennessee and Florida) and a few don’t collect any sales tax (like Montana).
Despite these differences, every state taxes property and this is where the true disparities are found. New Jerseyans fork over an average $7,163 in property taxes each year, representing an incredible 31% of their total tax burden. Compare that to West Virginians, who pay only $544, or 6%, of their total tax burden in property taxes. That means property taxes are 5 times more expensive in relative terms—or 13 times more expensive in absolute terms—in New Jersey than West Virginia!
Another interesting trend in our visualization is how clearly it reflects the partisan nature of different states’ decisions about taxes. President Trump won none of the 15 states with the highest tax burdens, and Hillary Clinton won only one of the 15 with the lowest (New Mexico). Many of the states typically considered political “swing states” come election time are in the middle of the pack; for example, Wisconsin (21st), Iowa (24th), Pennsylvania (26th), Michigan (30th), and Ohio (35th). How Trump’s recent tax cut bill (or even a second one) will affect the political landscape is anyone’s guess, but our graph makes us wonder if political divisions determine tax rates or if tax rates determine political divisions.
So why doesn’t everyone move to low-tax states? To a certain extent, rich people are actually leaving states with high tax burdens for places with friendlier policies. Most people can’t afford to relocate their entire families even if it would mean hundreds of dollars in tax savings, but at the very high end the numbers can really add up and may make a big move worth the cost.