For all the explanations offered up for the latest equity sell-off, technical analysts say there’s just one reason it hasn’t been worse.
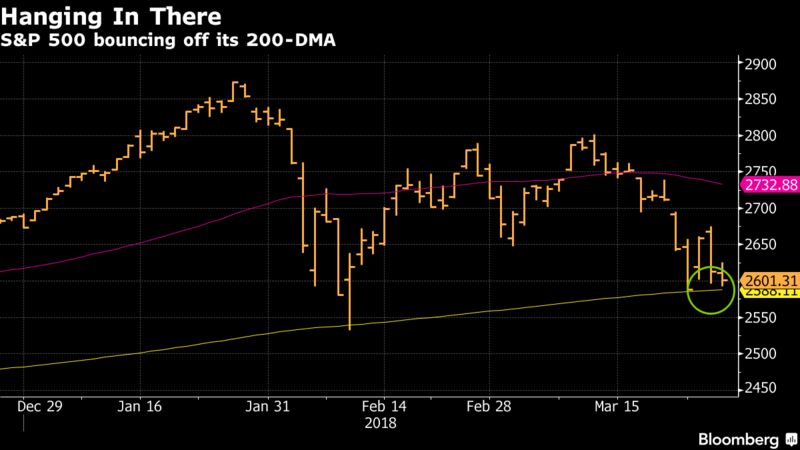
The S&P 500 Index’s 200-day moving average held for a fourth straight day Wednesday in a feat that’s severely testing market psychology. If it fails, the stocks are in for a slide of up to 5 percent, according to Adam Turnquist, Piper Jaffray’s technical analyst.
That would take the S&P 500 down to the 2,480-2,490 range, some 14 percent below its January record. The measure fell 0.3 percent to 2,606.24 as of 1:03 p.m. in New York, after earlier sliding to 2,593, five points above the average price over 200 days.
Matt Maley, an equity strategist at Miller Tabak, is less precise, but warned in a note Wednesday that, “If the S&P breaks both its 200-DMA and its February lows anytime soon, it’s going to be quite negative for the stock market.”
While few explanations for stock market moves can be less satisfying than technical levels, the 200-day bulwark provides an unassailable reason for why downside moves have faltered this year. The reason it’s held so far, the thinking holds, is that investors who watched stocks do nothing but rise for almost two years will move into the market when declines reach certain points.
For Evercore ISI technical strategist Rich Ross, there’s no better place than the 200 day. And even if the line is punctured, as it was in February, there’ll be a “big intraday reversal off that level to mark a better washout low like we saw in February.”
Back then, the S&P 500 plunged through the line midday only to surge more than 1 percent into the close.
Katie Stockton, founder of Fairlead Strategies LLC, said in an interview Wednesday that it’d take more than just a short foray below the line to signal more selling.
“If you saw it dip below, it might create a little flurry of selling pressure — but it would likely be just reactive as opposed to something indicative of a breakdown. If we saw it below for two weeks, that would be more concerning than for two days.”
Stockton said moving averages can be a good gauge of the prevailing trend and the 200-DMA is widely followed, but “it’s not like there’s a precise window — there are way too many market participants for that. It’s more like a cushion.”