CLICK ON CHART TO ENLARGE
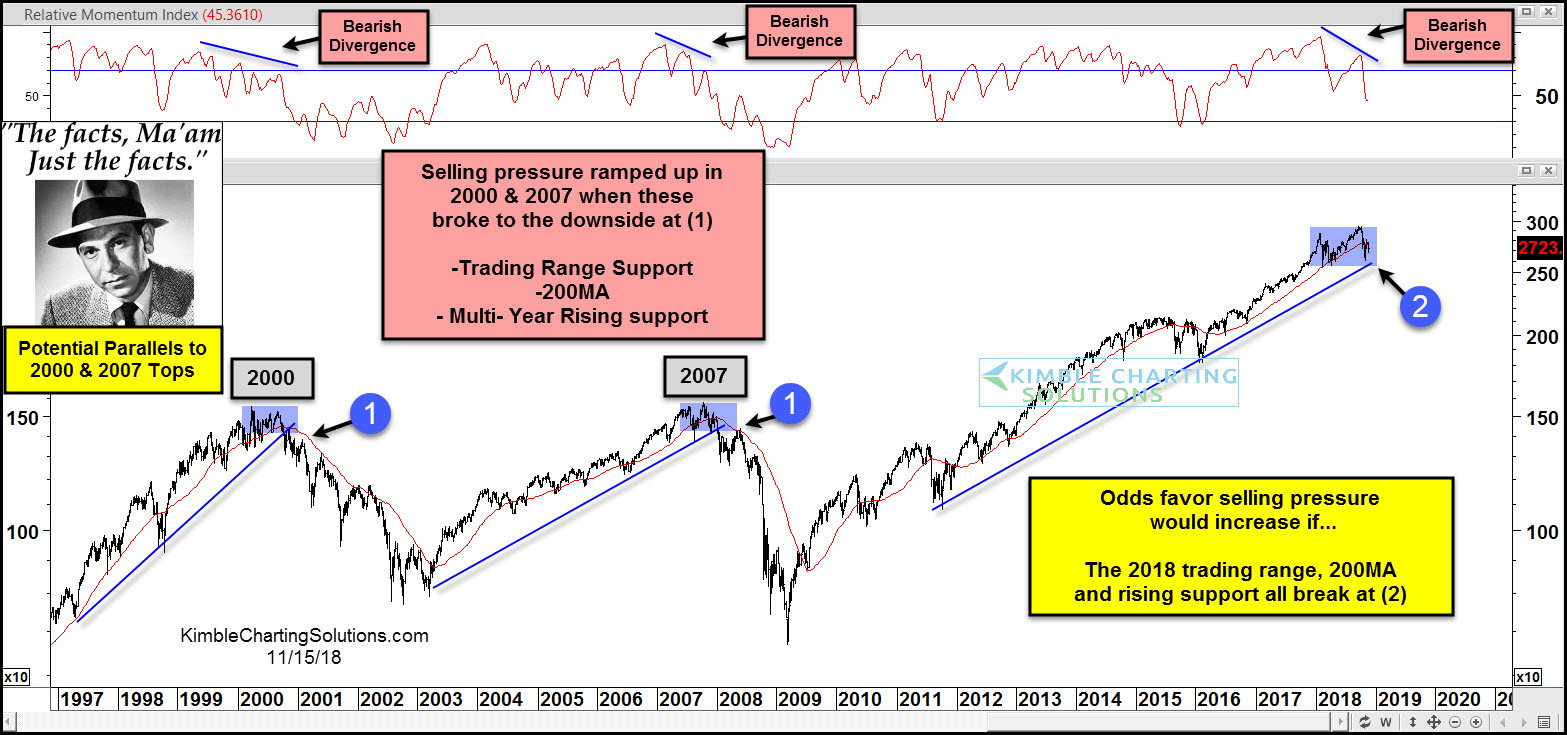
Trouble started for the S&P 500 in 2000 when momentum diverged for months, it broke below multi-month trading range support, 200-day moving average, and multi-year rising support at (1).
Trouble started for the S&P 500 in 2007 when momentum diverged for months, it broke below multi-month trading range support, 200-day moving average, and multi-year rising support at (1).
Joe Friday Just The Facts Ma’am– With momentum diverging for the past 9-months, if it breaks below the 2018 trading range, 7-year rising support and its 200-MA at (2), odds favor that selling pressure will increase.
Views: