CLICK ON CHART TO ENLARGE
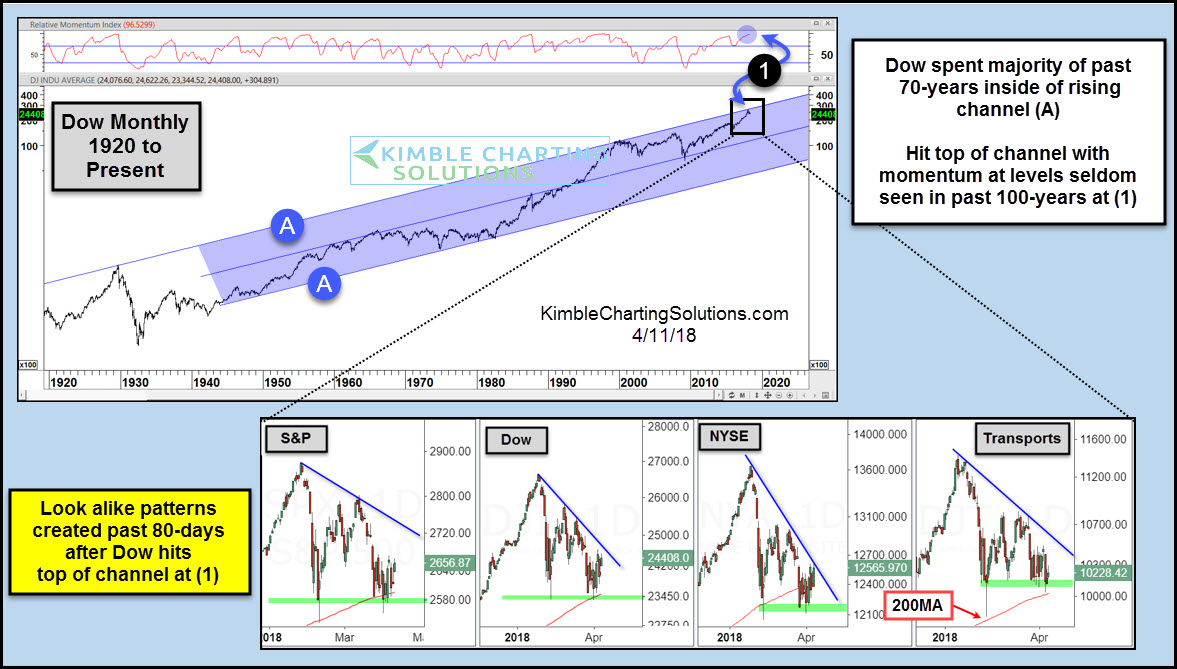
The Dow has spent the majority of the past 70-years inside of bullish rising channel (A). It hit the top of this channel in January at (1), as monthly momentum was hitting levels last seen in 2007, 2000, 1987, 1957 and 1929.
The 4-pack highlights look-alike patterns several indices have created since the Dow hit the top of the channel in January.
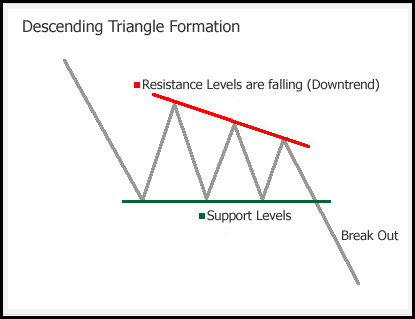
The 4-pack highlights that it is possible (not proven) that these indices are creating descending triangle patterns.
If the pattern read would happen to be true, this is not the ideal pattern to be taking place a the top of a 70-year channel with momentum at levels seldom seen in 100-years. The long-term trend remains up and nothing over the past 80-days has changed that! The bullish long-term trend would get a short-term negative message if strong horizontal support and 200-day moving averages would break to the downside.
If these indices break above falling resistance (series of lower highs), it would send a positive message to stock market bulls and would suggest that the potential descending triangles are nothing to be concerned about.
How these indices resolve the patterns over the past 80-days will be important months ahead for both bulls and bears.