by Dana Lyons

Both the S&P 500 and its volatility index have been rallying; which one has it right?
In the most recent portion of the relentless stock market rally, stocks have had plenty of company among other assets. Among those other areas joining stocks in this recent rally, are bond yields, foreign currencies, crude oil, precious metals and volatility expectations. Which of those things doesn’t belong? If you guessed volatility expectations, you are correct.
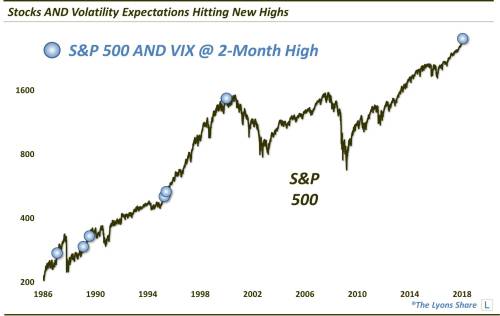
Typically, stock volatility expectations, e.g., the S&P 500 Volatility Index, or VIX, tend to move opposite the direction of stocks. What makes this recent run unusual is that both the S&P 500 (SPX) and the VIX have been moving higher. And, in fact, both the SPX and the VIX closed yesterday at a 2-month high. That does not happen very often. As proof, this was the first time since the final day of the last millennium.
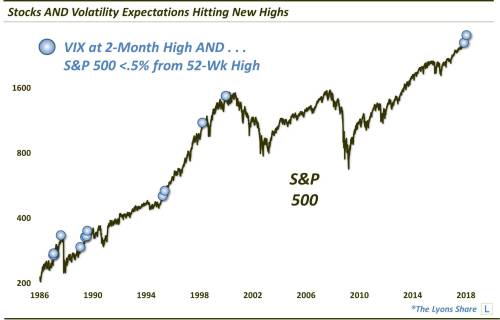
Additionally, yesterday, obviously, also marked the first day ever in which the SPX closed at a 52-week high while the VIX closed at a 2-month high. The following chart shows all of the incidents in which the VIX closed at a 2-month high and the SPX was within a half of 1% of its 52-week high. There have been 15 such days (with several of the same dates as the first chart).
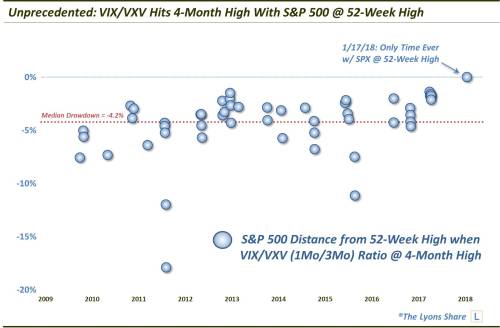
One more study we looked at on the topic has to do with the term structure of the volatility market. As a refresher, when traders get nervous about stocks, they typically bid up the price of closer-dated volatility indices, e.g., the 1-month VIX, versus longer-dated ones, e.g., the 3-month VXV. That typically occurs as a result of market declines. Not this time. While the SPX closed at a 52-week high yesterday, the VIX/VXV ratio closed at a 4-month high. That has never happened before. In fact, the SPX is typically an average of 4.2% below its 52-week high when the VIX/VXV ratio is at a 4-month high.
So what is the message being sent here? Are stocks pointing to further gains, or is the VIX sending a subtle warning sign regarding a coming uptick in volatility? Which price series, if either, is correct? In a Premium Post at The Lyons Share, we take a look at the specific dates in the studies above – and the S&P 500?s subsequent performance – to see if we can find any clues about how stocks might react to these unusual conditions.