Wolf Richter wolfstreet.com, www.amazon.com/author/wolfrichter
Rents plunge in Chicago, Honolulu, New York, Washington DC, and others, but surge in many markets.
Across the US in August, the median asking rent for 1-bedroom apartments rose 2.2% from a year ago, to $1,209. For two-bedroom apartments, it rose 3.2% to $1,447. But national numbers average away the often-double-digit drama, up and down, that renters and landlords experience in individual markets, with rents soaring over 10% and even over 16% year-over-year in some markets, while rents plunged in other markets.
For example, in Southern California, rents are jumpy: In San Diego, the median asking rent for 1-BR apartments in August rose 9.8% year-over-year to $1,810; and for 2-BR apartments, it rose 8.7% to $2,490. In Long Beach, 1-BR asking rents jumped 14.6% and 2-BR asking rents 8.7%.
In 12 less expensive markets, rents jumped by 16% or more.
But some cities go in the other direction. In Chicago, for example, rents peaked in October 2015 and have since spiraled down 26% for 1-BR apartments and 30% for 2-BR apartments.
Every market has its own dynamics. Like many cities, Chicago has had an apartment construction boom. In the Chicago-Naperville-Elgin metro area, with 9.5 million people, 10,700 apartments are scheduled to be delivered in 2018. But Chicago’s population peaked in 2014 and has since dropped by 27,000 people. So a lot of new supply meets declining demand.
These are median asking rents. “Median” means half of the apartments rent for more, and half for less. “Asking rent” is the amount the landlord advertises in the listing. The apartments are in multifamily buildings, including new construction. But single-family houses for rent are not included. “Rooms,” efficiency apartments, and apartments with three bedrooms or more are not included. The data is not consumer-survey-based. It was collected by Zumper from over 1 million active listings of apartments-for-rent across the US during that month.
The data in Zumper’s National Rent Report reflects the current market as landlords are pricing it. But the data does not include “concessions,” such as “1 month free” or “2 months free.” In markets where concessions prevail, the effective rent for the first year of the lease would be lower than the asking rent.
No one tracks actual lease signings, and landlords do not report them. Only consumer surveys, such as those conducted by the Census Bureau, provide some survey-based insights into that, long after the fact.
The table below shows the 17 of the 100 most expensive major rental markets in the US. The shaded area reflects peak rents and the movements since then. The black “0%” in the shaded area means that these markets set new records in August. If rents are down slightly from the peak a few months ago, it doesn’t yet mean that the market has turned – a turning point would require a more significant decline in rents spread over a number of months beyond seasonality.
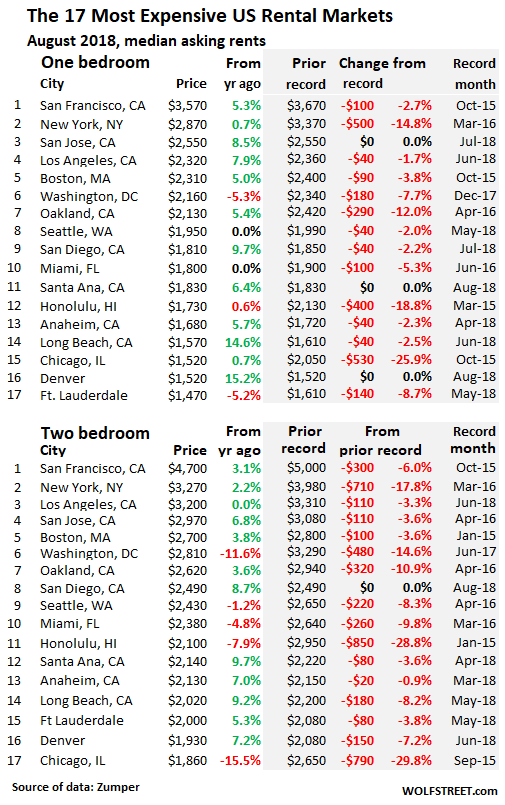
Some standouts:
San Francisco is by far the most expensive major rental market in the US. There are more expensive markets, including some towns in Silicon Valley, but these are too small to make the list. San Francisco rents peaked in October 2015. By late 2017 and early 2018, 2-BR rents were down about 12% from the October 2015 peak of $5,000. But starting in the spring this year, rents started rising again. At this point, they still remain below their 2015 peak.
Washington DC rents have suddenly come under pressure: 1-BR rents in August are down 8% from their peak in December 2017. And 2-BR rents have plunged nearly 15% from June 2017.
New York City, the second most expensive rental market, looks to be trying to find a bottom. Year-over-year, asking rents are up slightly but have fallen by the double-digits from their peaks in March 2016.
Honolulu rents rank up there with Chicago. The median asking rent for 1-BR apartments has plunged 19% from the peak in March 2015. And the median 2-BR rent has plunged 29% from the peak in January 2015.
In the Seattle metro, a historic construction boom is likely to deliver 8,600 new apartments this year, with 25,000 additional apartments under construction. In addition, a large number of apartments were completed in prior years. This flood of supply coming on the market is high-end, and affordability has become a crisis, though not quite as bad as in San Francisco.
Despite this onslaught of supply, Seattle’s median 1-BR asking rent hit a record in June, and August was off just a tad. But 2-BR rents are 8% below the peak in April 2016. Price resistance appears to have kicked in, and people are compromising on space to get a slightly less expensive but smaller unit. There is anecdotal evidence that the market has turned, but the only place where this is showing up in the asking-rent numbers is in 2-BR apartments.
Some of the remaining markets in the US have experienced double-digit year-over-year rent increases – including 12 cities where these increases reached 16%, such as in Cleveland, OH, or Wichita, KS.
In fact, in the lower half of the list of the 100 most expensive rental markets (below), year-over-year rent increases of 15% and over are fairly common. So when some people say that their rent increases were much higher than the increases in the Consumer Price Index for rent, that’s why. For these people exorbitant rent increases are real. But in other cities, rent declines have set in, which water down the national average.
The table below shows Zumper’s list of the 100 most expensive major rental markets in the US, in order of median asking rent for 1-BR apartments in August, and percentage changes from a year ago (use the browser search function to find a city):
| 1 BR | Y/Y % | 2 BR | Y/Y % | ||
| Pos. | City | Rent | change | Rent | change |
| 1 | San Francisco, CA | $3,570 | 5.3% | $4,700 | 3.1% |
| 2 | New York, NY | $2,870 | 0.7% | $3,270 | 2.2% |
| 3 | San Jose, CA | $2,550 | 8.5% | $2,970 | 6.8% |
| 4 | Los Angeles, CA | $2,320 | 7.9% | $3,200 | 0.0% |
| 5 | Boston, MA | $2,310 | 5.0% | $2,700 | 3.8% |
| 6 | Washington, DC | $2,160 | -5.3% | $2,810 | -11.6% |
| 7 | Oakland, CA | $2,130 | 5.4% | $2,620 | 3.6% |
| 8 | Seattle, WA | $1,950 | 0.0% | $2,430 | -1.2% |
| 9 | Santa Ana, CA | $1,830 | 6.4% | $2,140 | 9.7% |
| 10 | San Diego, CA | $1,810 | 9.7% | $2,490 | 8.7% |
| 11 | Miami, FL | $1,800 | 0.0% | $2,380 | -4.8% |
| 12 | Honolulu, HI | $1,730 | -0.6% | $2,100 | -7.9% |
| 13 | Anaheim, CA | $1,680 | 5.7% | $2,130 | 7.0% |
| 14 | Long Beach, CA | $1,570 | 14.6% | $2,020 | 9.2% |
| 15 | Philadelphia, PA | $1,540 | 9.2% | $1,730 | 8.1% |
| 16 | Chicago, IL | $1,520 | 0.7% | $1,860 | -15.5% |
| 16 | Denver, CO | $1,520 | 15.2% | $1,930 | 7.2% |
| 18 | Atlanta, GA | $1,470 | 10.5% | $1,870 | 10.7% |
| 18 | Fort Lauderdale, FL | $1,470 | -5.2% | $2,000 | 5.3% |
| 20 | Providence, RI | $1,440 | 0.7% | $1,520 | 3.4% |
| 21 | Minneapolis, MN | $1,410 | 11.9% | $1,910 | 7.9% |
| 22 | Portland, OR | $1,400 | 3.7% | $1,640 | 2.5% |
| 23 | Baltimore, MD | $1,390 | 7.8% | $1,740 | 16.0% |
| 24 | New Orleans, LA | $1,370 | 9.6% | $1,550 | -1.9% |
| 25 | Nashville, TN | $1,360 | 14.3% | $1,400 | 0.0% |
| 26 | Madison, WI | $1,290 | 7.5% | $1,410 | 13.7% |
| 27 | Dallas, TX | $1,260 | -7.4% | $1,710 | -9.0% |
| 27 | Houston, TX | $1,260 | 13.5% | $1,600 | 16.8% |
| 27 | Sacramento, CA | $1,260 | 11.5% | $1,460 | 13.2% |
| 30 | Orlando, FL | $1,240 | 12.7% | $1,460 | 16.8% |
| 30 | Scottsdale, AZ | $1,240 | 3.3% | $1,900 | -9.5% |
| 32 | Austin, TX | $1,200 | 9.1% | $1,490 | 6.4% |
| 33 | Tampa, FL | $1,170 | 11.4% | $1,390 | 13.0% |
| 34 | Charlotte, NC | $1,150 | 2.7% | $1,290 | 4.9% |
| 34 | Plano, TX | $1,150 | 0.0% | $1,560 | 0.6% |
| 36 | Aurora, CO | $1,140 | 14.0% | $1,440 | 3.6% |
| 37 | Durham, NC | $1,130 | 10.8% | $1,270 | 15.5% |
| 38 | Newark, NJ | $1,120 | 12.0% | $1,390 | 15.8% |
| 38 | Pittsburgh, PA | $1,120 | -11.1% | $1,350 | 1.5% |
| 40 | Irving, TX | $1,110 | -6.7% | $1,460 | -0.7% |
| 41 | Gilbert, AZ | $1,080 | 2.9% | $1,340 | 3.9% |
| 42 | Henderson, NV | $1,070 | 11.5% | $1,260 | 16.7% |
| 42 | Virginia Beach, VA | $1,070 | 4.9% | $1,220 | 1.7% |
| 44 | Fort Worth, TX | $1,060 | 9.3% | $1,330 | 15.7% |
| 44 | Richmond, VA | $1,060 | 5.0% | $1,240 | 3.3% |
| 46 | Buffalo, NY | $1,050 | 10.5% | $1,420 | 13.6% |
| 46 | Chandler, AZ | $1,050 | 7.1% | $1,290 | 7.5% |
| 48 | Chesapeake, VA | $1,040 | 15.6% | $1,200 | 0.0% |
| 48 | Salt Lake City, UT | $1,040 | 15.6% | $1,350 | 15.4% |
| 50 | St Petersburg, FL | $1,010 | 9.8% | $1,520 | 15.2% |
| 51 | Raleigh, NC | $1,000 | 1.0% | $1,190 | 8.2% |
| 52 | Jacksonville, FL | $970 | 7.8% | $1,100 | 4.8% |
| 52 | Phoenix, AZ | $970 | 14.1% | $1,180 | 9.3% |
| 54 | Kansas City, MO | $950 | 11.8% | $1,120 | 14.3% |
| 55 | Boise, ID | $940 | 16.0% | $1,000 | 8.7% |
| 56 | Las Vegas, NV | $930 | 14.8% | $1,130 | 15.3% |
| 57 | Milwaukee, WI | $920 | 15.0% | $1,100 | 17.0% |
| 58 | Anchorage, AK | $910 | 4.6% | $1,140 | -0.9% |
| 58 | Fresno, CA | $910 | 11.0% | $1,080 | 9.1% |
| 58 | San Antonio, TX | $910 | 8.3% | $1,170 | 13.6% |
| 61 | Colorado Springs, CO | $900 | 8.4% | $1,120 | 4.7% |
| 62 | Louisville, KY | $880 | 6.0% | $1,000 | 12.4% |
| 62 | Mesa, AZ | $880 | 8.6% | $1,010 | 6.3% |
| 64 | Corpus Christi, TX | $860 | 2.4% | $1,080 | 3.8% |
| 64 | Des Moines, IA | $860 | 8.9% | $920 | 7.0% |
| 66 | Baton Rouge, LA | $840 | 6.3% | $940 | 5.6% |
| 66 | Omaha, NE | $840 | 6.3% | $1,110 | 13.3% |
| 68 | Laredo, TX | $830 | 15.3% | $990 | 16.5% |
| 68 | Reno, NV | $830 | 12.2% | $1,220 | 16.2% |
| 68 | Rochester, NY | $830 | 15.3% | $1,000 | 14.9% |
| 68 | Syracuse, NY | $830 | 0.0% | $1,060 | 11.6% |
| 72 | Knoxville, TN | $820 | 15.5% | $930 | 16.3% |
| 72 | Norfolk, VA | $820 | 15.5% | $950 | 5.6% |
| 74 | Arlington, TX | $810 | 15.7% | $1,090 | 16.0% |
| 75 | Cincinnati, OH | $800 | 15.9% | $1,080 | 14.9% |
| 75 | Columbus, OH | $800 | 14.3% | $1,050 | 15.4% |
| 75 | Winston Salem, NC | $800 | 15.9% | $840 | 15.1% |
| 78 | St Louis, MO | $790 | 16.2% | $1,130 | 16.5% |
| 79 | Cleveland, OH | $780 | 16.4% | $880 | 15.8% |
| 80 | Chattanooga, TN | $770 | 8.5% | $810 | 8.0% |
| 80 | Glendale, AZ | $770 | 14.9% | $1,000 | 12.4% |
| 82 | Bakersfield, CA | $760 | 11.8% | $890 | 1.1% |
| 83 | Lexington, KY | $750 | -5.1% | $910 | -2.2% |
| 83 | Memphis, TN | $750 | 13.6% | $800 | 14.3% |
| 85 | Spokane, WA | $740 | 13.8% | $900 | 9.8% |
| 86 | Greensboro, NC | $730 | 10.6% | $820 | -2.4% |
| 86 | Tallahassee, FL | $730 | 15.9% | $860 | 7.5% |
| 88 | Oklahoma City, OK | $720 | 14.3% | $860 | 10.3% |
| 89 | Augusta, GA | $710 | 9.2% | $830 | 5.1% |
| 89 | Lincoln, NE | $710 | 10.9% | $960 | 15.7% |
| 91 | Albuquerque, NM | $670 | 6.3% | $830 | 3.8% |
| 91 | Indianapolis, IN | $670 | 13.6% | $800 | 15.9% |
| 93 | Shreveport, LA | $640 | 12.3% | $720 | 10.8% |
| 94 | Detroit, MI | $630 | 14.5% | $720 | 14.3% |
| 94 | El Paso, TX | $630 | 1.6% | $770 | 4.1% |
| 94 | Tucson, AZ | $630 | -3.1% | $850 | 0.0% |
| 94 | Tulsa, OK | $630 | 6.8% | $780 | 5.4% |
| 98 | Lubbock, TX | $620 | 12.7% | $770 | 2.7% |
| 99 | Wichita, KS | $600 | 13.2% | $770 | 16.7% |
| 100 | Akron, OH | $540 | 0.0% | $740 | 12.1% |