Over the last three weeks, we have discussed the “sellable rally” in the markets. However, one of the more stunning movements in the market was in interest rates which have fallen sharply in recent months as “deflation” and “economic weakness” have become points of concern for the Federal Reserve.
Just last year, the Federal Reserve was hiking rates with the expectations of stronger economic growth and rising inflationary pressures from a tight labor market. Almost a year later, the markets, and the White House, are begging for the Fed to cut rates, and stop reducing their balance sheet, as the economic data has weakened substantially.
Despite these concerns, the markets remain within reach of all-time highs as the market continues to ignore the risks under the assumption “this time is different” and the Fed will indeed “come to the rescue.”
Will that be the case? No one knows for sure.
What we do know is that markets move based on sentiment and positioning. This makes sense considering that prices are affected by the actions of both buyers and sellers at any given time. Most importantly, when prices, or positioning, becomes too “one-sided,” a reversion always occurs. As Bob Farrell’s Rule #9 states:
“When all experts agree, something else is bound to happen.”
So, how are traders positioning themselves currently?
Positioning Review
The COT (Commitment Of Traders) data, which is exceptionally important, is the sole source of the actual holdings of the three key commodity-trading groups, namely:
- Commercial Traders: this group consists of traders that use futures contracts for hedging purposes and whose positions exceed the reporting levels of the CFTC. These traders are usually involved with the production and/or processing of the underlying commodity.
- Non-Commercial Traders: this group consists of traders that don’t use futures contracts for hedging and whose positions exceed the CFTC reporting levels. They are typically large traders such as clearinghouses, futures commission merchants, foreign brokers, etc.
- Small Traders: the positions of these traders do not exceed the CFTC reporting levels, and as the name implies, these are usually small traders.
The data we are interested in is the second group of Non-Commercial Traders.
This is the group that speculates on where they believe the market is headed. While you would expect these individuals to be “smarter” than retail investors, we find they are just as subject to “human fallacy”and “herd mentality” as everyone else.
Therefore, as shown in the series of charts below, we can take a look at their current net positioning (long contracts minus short contracts) to gauge excessive bullishness or bearishness. With the exception of the 10-Year Treasury which I have compared to interest rates, the others have been compared to the S&P 500.
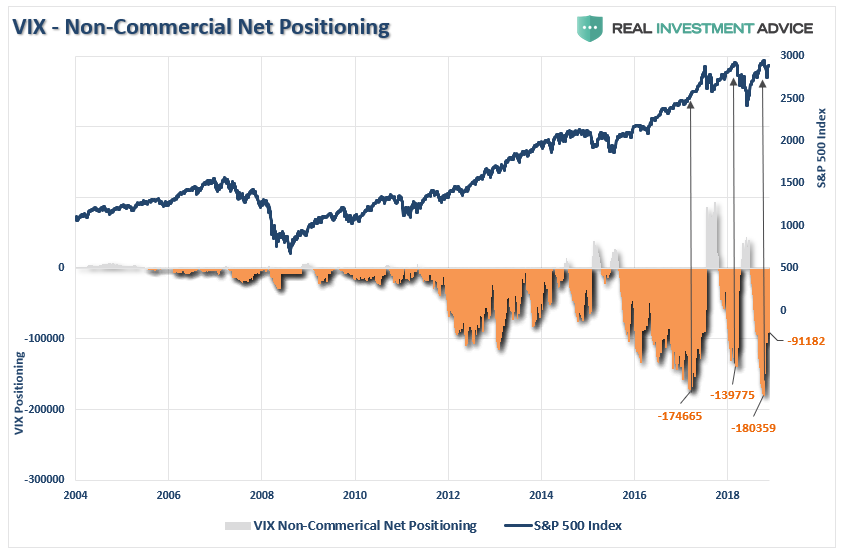
Volatility Not Marking A Bottom
The extreme net-short positioning on the volatility index in early May suggested a peak to the advance from the December lows was likely. However, while the short-positioning has been reduced over the last several weeks as the market has corrected, there is still a sizable short-position which exists.
Given that most “bottoms” occur when short-VIX positioning has been fully reversed, the complacency of the recent decline suggests that a disappointment by the Federal Reserve, a failure of any progress on trade, or some other economy shock, could lead to a deeper decline.
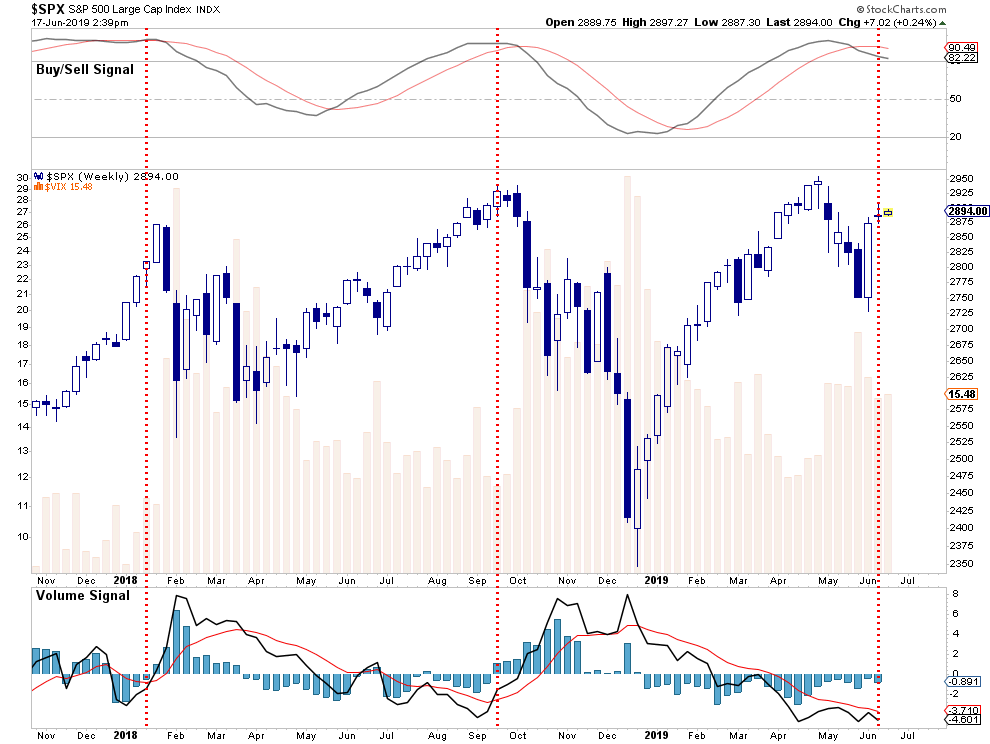
While the market did bounce following the sell-off in May, as we have been discussing in our series on a “Sellable Rally,” that rally is occurring within the confines of a longer-term “sell signal,” (upper panel) and falling volume. Historically, when both the “sell signal” turns lower, and the “volume signal” turns higher, such has marked important tops for the market.
It is likely the continuation of the correction will occur as we head into July and August.
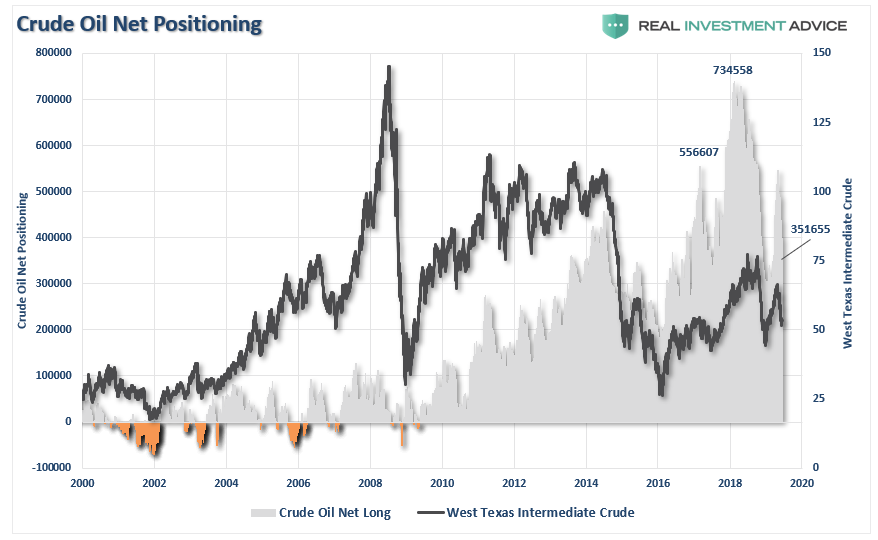
Crude Oil Extreme
The recent attempt by crude oil to get back above $60/bbl coincided with a “mad rush” by traders to be long the commodity. However, they failed to take into account the building supply of crude oil in the face of a drop in demand amidst a slowing economic backdrop. Crude traders currently remain very “long” the commodity, despite the recent drop back to $50/bbl, as we warned our RIA PRO subscribers (Try 30-Days FREE)
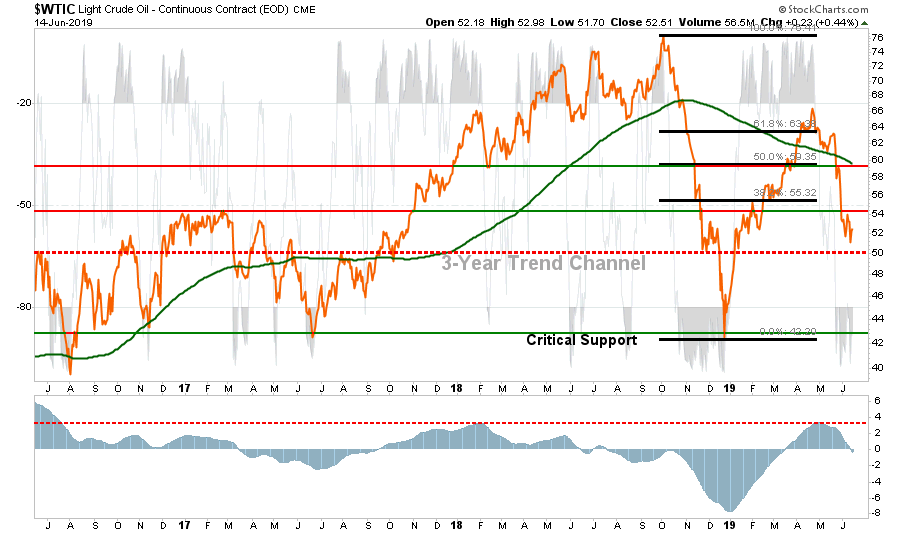
- A month ago, we noted the rally in oil had gotten way ahead of itself in the face of building supplies and that the risk was clearly to the downside. We also noted that if support at $60 failed, along with the 200-dma, the risk was to the mid- to low-$50’s.
- Despite the Iran issue last week, supply builds continue to weigh on oil prices. Support is at $50/bbl. A break below that is a whole other issue and will likely indicate the onset of recession.
- Oil remains deeply oversold, so a counter-trend bounce in oil prices will not be surprising. Such would be in conjunction with a market rally on positive news from the Fed and the G-20 meeting.
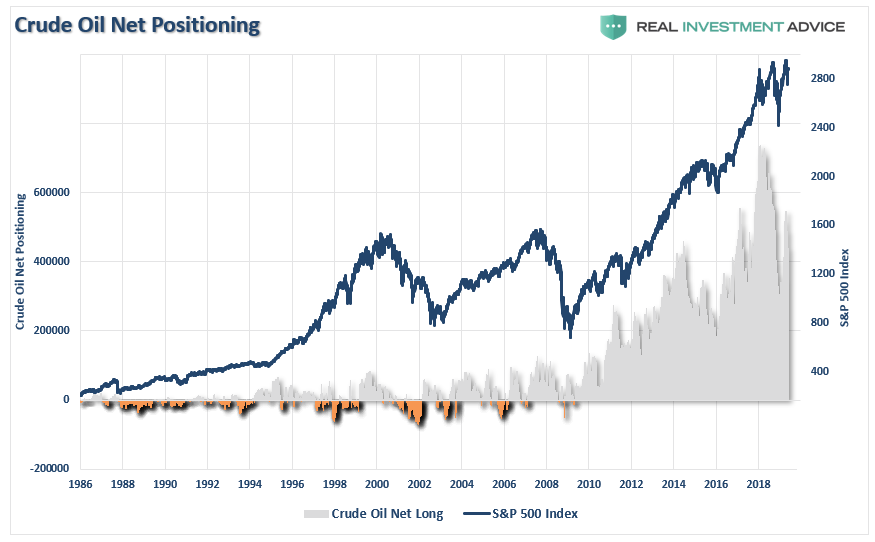
It is worth noting that crude oil positioning is also highly correlated to overall movements of the S&P 500 index. Therefore, a deeper reversal in oil prices will likely coincide with a further correction in the S&P 500.
While oil prices could certainly fall below $40/bbl for a variety of reasons, the recent bottoming of oil prices around $45/bbl should provide some reasonable support (barring an economic recession.)
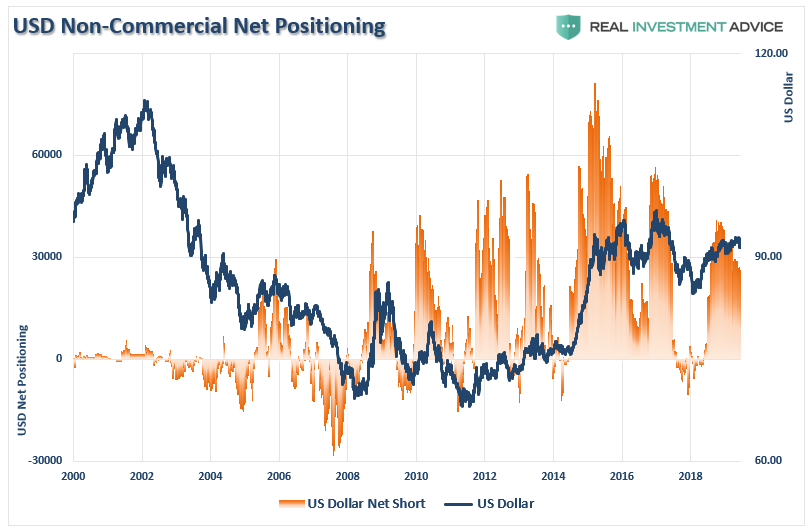
US Dollar Extreme
Recent weakness in the dollar has been used as a rallying call for the bulls. However, a reversal of US Dollar positioning has not been extremely sharp and there remains a fairly large long-bias to dollar positioning. Importantly, as shown in the chart below, the reversal of dollar-long positioning is usually reflective of short- to intermediate-term market peaks.
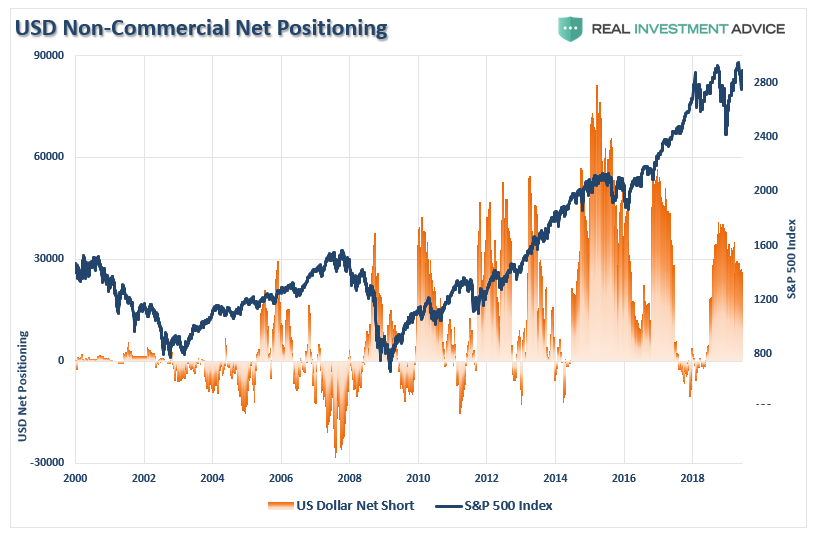
As shown above, and below, such net-long positions have generally marked both a short to intermediate-term weakness in the dollar. The good news is that a weak dollar should bode well for both oil and gold prices which trade globally in U.S. dollars.
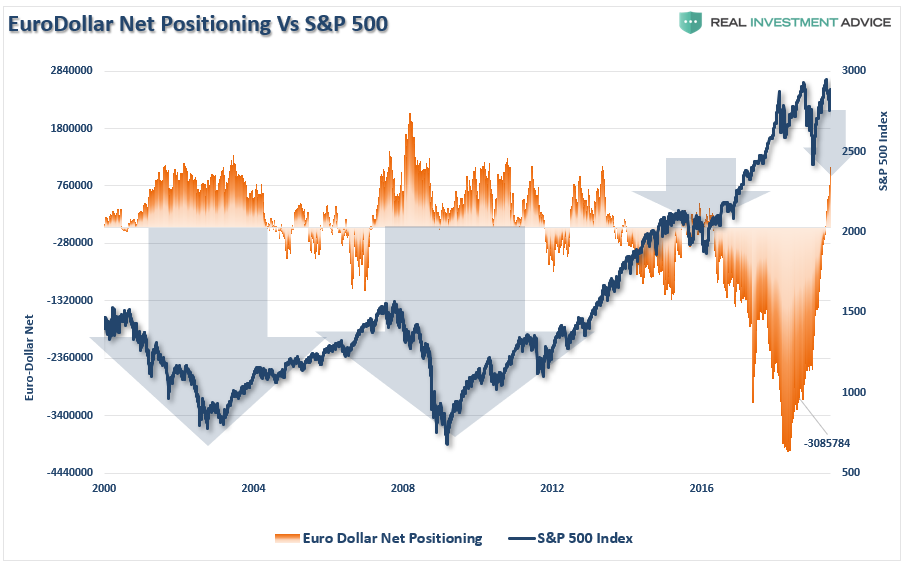
It is also worth watching the net-short positioning the Euro-dollar as well. Historically, when positioning in the Eurodollar becomes NET-LONG, as it is currently, such has been associated with short- to intermediate corrections in the markets, including outright bear markets. The reversal is still early but worth watching closely.
Interest Rate Extreme
One of the biggest conundrums for the financial market “experts” is why interest rates fail to rise. Earlier this year, I wrote “The Bond Bull Market” which was a follow up to our earlier call for a sharp drop in rates as the economy slowed. That call was based on the extreme “net-short positioning” in bonds which suggested a counter-trend rally was likely.
The last time I wrote this report I stated:
“The reversal of the net-long positioning in Treasury bonds will likely push bond yields lower over the next few months. This will accelerate if there is a“risk-off” rotation in the financial markets in the weeks ahead.”
Both things occurred.
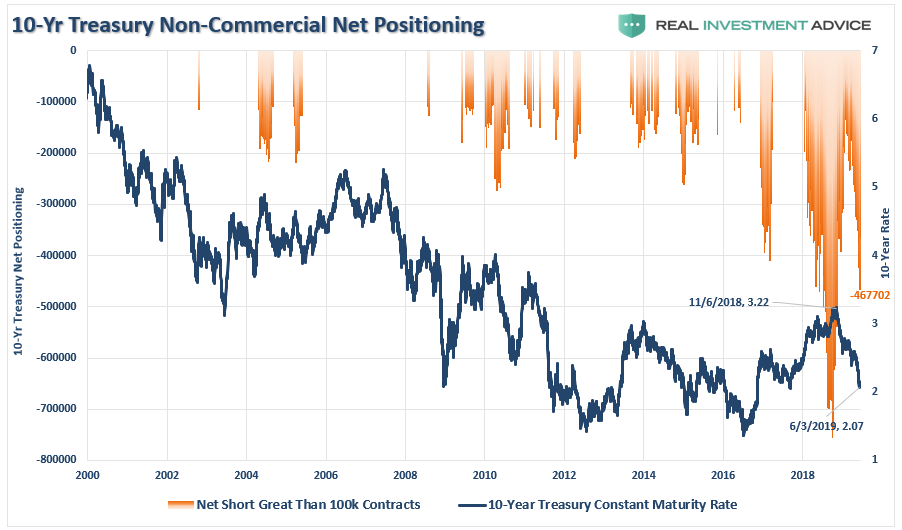
However, as shown in the updated chart below, despite the sharp drop in rates, traders are still betting on a surge in rates and the net-short positioning on the 10-year Treasury is at the second highest level on record. Combined with the recent spike in Eurodollar positioning, as noted above, it suggests that there is a high probability that rates will fall further in the months ahead; most likely in concert with the onset of a recession.
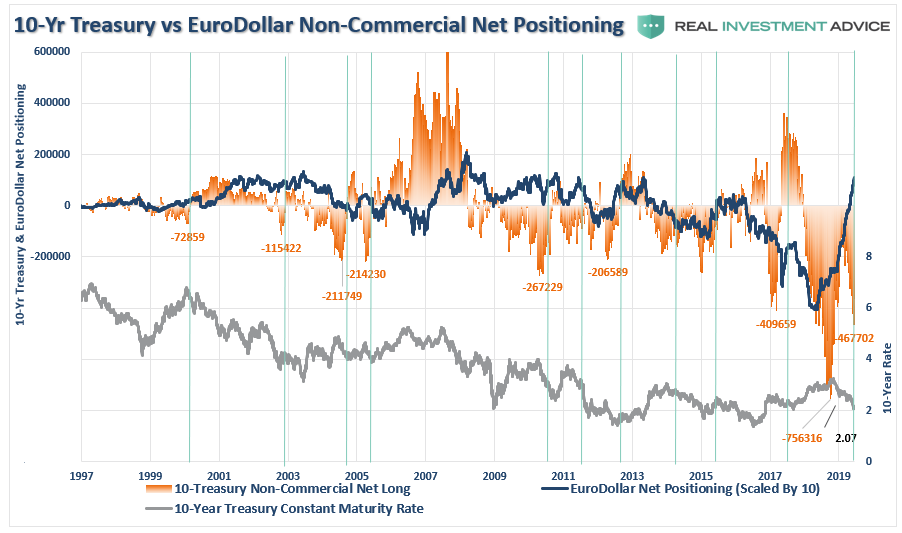
The chart below looks at net-short positioning ONLY when net-short contracts exceed 100,000. Since peaks in net-short contracts generally coincide with peaks in interest rates, it suggests there is more room for rates to fall currently.
Amazingly, investors seem to be residing in a world without any perceived risks and a strong belief that the financial markets are NOT at risk. The arguments supporting those beliefs are based on comparisons to previous peak market cycles and current positioning suggests traders believe the “bulls” will prevail.
Unfortunately, they tend to be wrong at the extremes.
The inherent problem with much of the mainstream analysis is that it assumes everything remains status quo. But data, markets, economies, and liquidity are never the same. The question is simply what can go wrong for the market?
In a word, “much.”
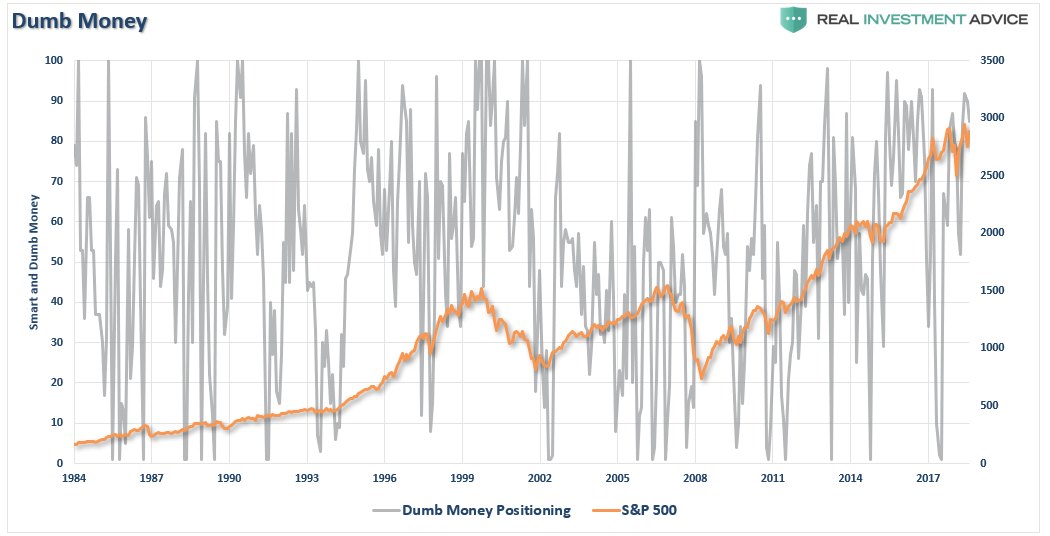
With retail positioning very long-biased, as shown in the chart below, the recent correction has not imposed a level of “fear” that would denote a more lasting market bottom has been put into place.
The other famous Bob Farrell Rule to remember:
“#5 – The public buys the most at the top and the least at the bottom.”
Just because a warning doesn’t immediately translate into a negative consequence, doesn’t mean you should not pat attention to it. It is akin to constantly running red lights and never getting into an accident. We begin to think we are skilled at running red lights, rather than just being lucky. Eventually, your luck will run out.
Pay attention, have a plan, and act accordingly.