With the month of February now officially in the books, we can take a look at our long-term monthly indicators to see what they are telling us now.
Is the bull market back?
That’s the answer we all want to know.
Each week on RIA PRO we provide an update on all of the major markets for trading purposes.
(See an unlocked version here. We also do the same analysis for each S&P 500 sector, selected portfolio holdings, and long-short ideas. You can try RIA PRO free for 30-days with code PRO30)
However, as longer-term investors and portfolio managers, we are more interested in the overall trend of the market. While it is fundamental analysis derives “what” we buy, it is the long-term “price” analysis which determines the “when” of the buying and selling aspects of portfolio management over the long-term.
For us, the best measures of the TREND of the market is through longer-term weekly and monthly data. Importantly, when using longer-term data these signals are only valid at the end of the period. It is not uncommon for signals to be triggered and reversed during the middle of the period which creates “false” signals and poor outcomes. Since we are more interested in discerning changes to the overall “trend” of the market, we find monthly indicators, which are slow moving, tend to reveal this more clearly.
In April of last year, I penned an article entitled “10-Reasons The Bull Market Ended” in which we discussed the yield curve, slowing economic growth, valuations, volatility, and sentiment. While volatility and sentiment have gone back into complacency, the fundamental and economic backdrop has deteriorated further. Had you heeded our warning then, you could have saved yourself some pain.
As of February’s end, despite the recent rally over the last two months, the market is still 4.8% lower than the previous peak. It also remains marginally lower than the January high. Despite the 12.5% rally over the last two months (open to close), the rally has only repaired the damage of the December decline.
(Fun with numbers: it took a 12.5% advance to repair a 10.2% decline. This is why measuring performance in percentage terms is deceiving.)
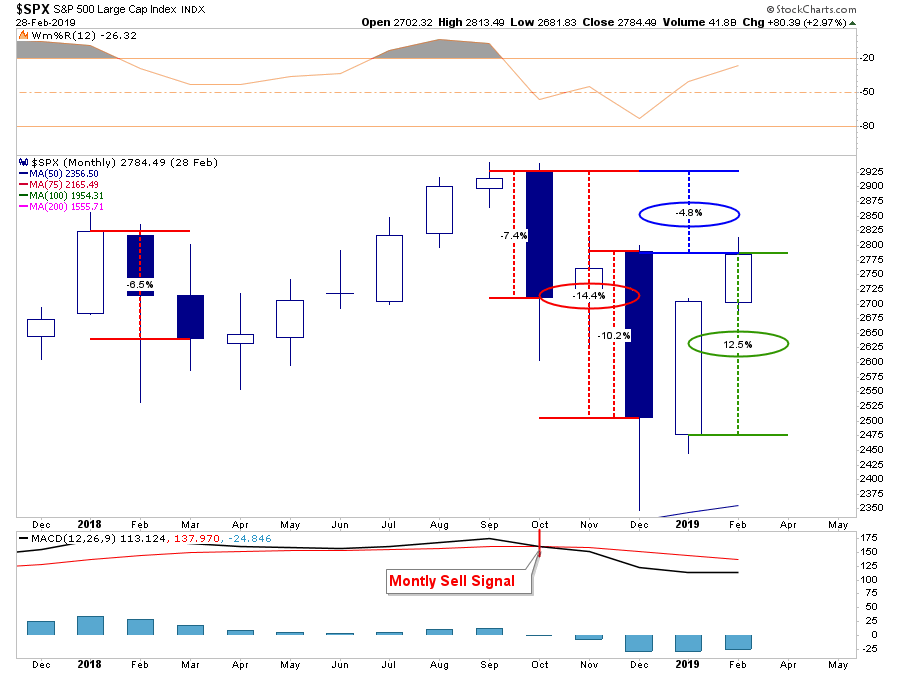
More importantly, note the MONTHLY SELL SIGNAL registered in the bottom panel of the chart above.
Given that monthly data is very slow moving, longer-term signals can uncover changes to trend which short-term market rallies tend to obfuscate.
The next chart shows the monthly buy/sell signals stretched back to 1999. As you will see, these monthly “buy” and “sell” indications are fairly rare over that period. During that period, only the 2015-2016 signal didn’t evolve into a deeper correction as Central Bank interventions flooded the markets with liquidity to stem the risk of a disorderly “Brexit” and slower economic growth.
Currently, we are once again facing slower global economic growth, the potential of a disorderly “Brexit” and Central Banks trying to reverse policy back to a more “accommodative” stance. Therefore, if Central Banks can support prices long-enough for economic data to trough and recover (data is cyclical) allowing earnings to rebound, the monthly signals will reverse putting the markets back into a “bullish” trend.

However, until those signals reverse, it tends to pay to “err to the side of caution.”
“But this time is different because of ‘_(fill in the blank__’”
Well, we can take those same monthly indicators and review them going back to 1950. I have added two confirming monthly indicators as well, so the vertical “red dashed lines” are when all three indicators have aligned which reduces false signals.
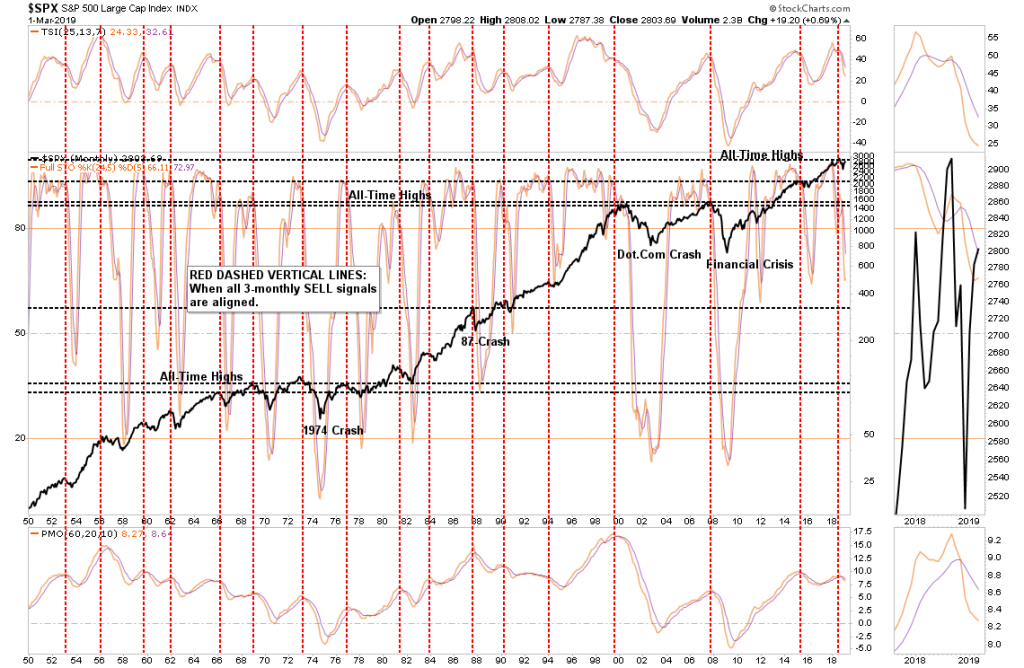
I can’t believe I actually have to write the next sentence, but if I don’t I invariably get an email saying “but if you sold out, you missed the whole rally.”
What should be obvious is that while the monthly “sell” signals have gotten you out to avoid more substantial destructions of capital, the reversal of those signals were signs to “get back in.” Investing, long-term is about both deployment of capital and the preservation of it.
Currently, the monthly indicators have all aligned to “confirm” a “sell signal” which since 1950 has been somewhat of a rarity. Yes, the recent signal could turn out to be a “1987” scenario where the market rallied immediately back and reversed the signals back to a “buy” a few months later. Or this could be the beginning of a more substantial corrective process over the course of many months.
The risk of ignoring the longer-term signal currently is the risk of a loss of what has been gained during the current reflexive rally. Yes, while waiting for the signal to reverse will equate to short-term underperformance, the long-term risk-adjusted returns have been more than enough to satisfy retirement planning goals which is why we started investing to begin with.
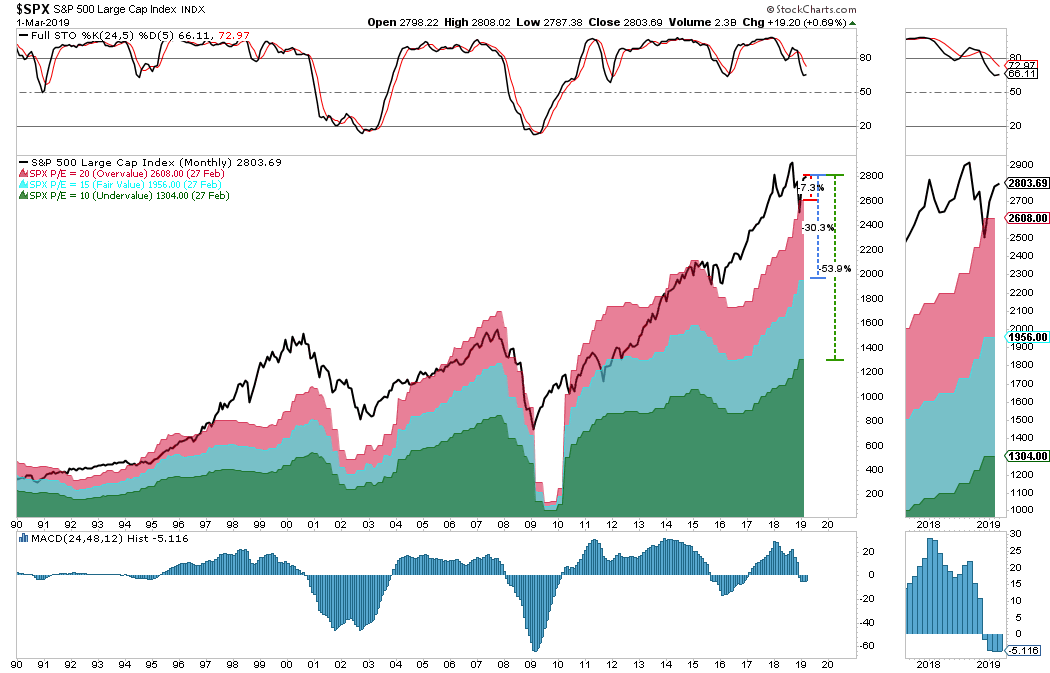
One of the biggest reasons not to equate the current monthly “sell” signal to a “1987” type period is valuations. In 1987, valuations were low and rising at a time where interest rates and inflation were high and falling. Today, that economic and valuation backdrop are entirely reversed. Currently, a correction from current price levels of the market to PE20 (20x current earnings) would be another 7.3% decline. However, a drop back to the long-term average of PE15 would entail a 30% decline and a reversion to PE10, which would be required to “reset” the market, would be a 53.9% fall.
Still not convinced?
I get it.
Emotionally, the hardest thing for investors to do is to sit on their hands and avoid “risk” when the markets are rising. But this is the psychological issue which plagues all investors over time which is to “buy high” and “sell low.”
It happens to everyone.
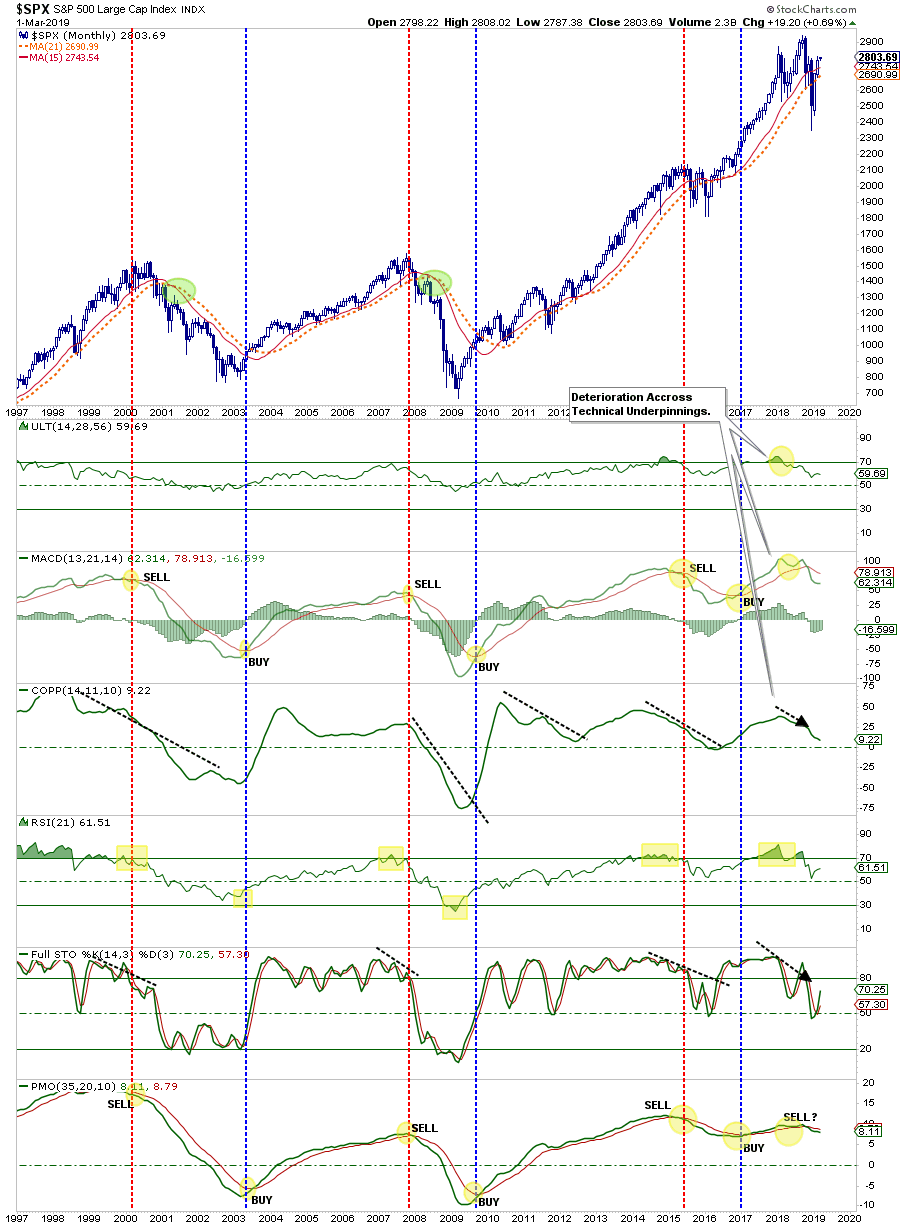
This is why we use technical signals to help reduce the “emotional” triggers which lead to poor investment decisions over the long-term. As I have noted before, the following chart is one of my favorites because it combines a litany of confirming signals all into one monthly chart.
Despite the recent rally, which has pushed prices back above their longer-term moving average, the longer-term trends of the signals remain “non-confirming” of the recent rally.
David Rosenberg summed up the current state of affairs very well yesterday:
“Well, the bulls certainly are emboldened, there isn’t any doubt about that. And this confidence, bordering on hubris, is proving very difficult to break. We are back to good news being good news and bad news is also treated as good news.”
He is right, but the technical signals, which do indeed lag short-term turns in the market, have not confirmed the bullish attitude. Rather, and as shown in the chart above, the negative divergence of the indicators from the market should actually raise some concerns over longer-term capital preservation.
What This Means And Doesn’t Mean
What this analysis DOES NOT mean is that you should “sell everything” and “hide in cash.”
As always, long-term portfolio management is about “tweaking” things over time.
At a poker table, if you have a “so so” hand, you bet less or fold. It doesn’t mean you get up and leave the table altogether.
What this analysis DOES MEAN is that we need to use this rally to take some actions to rebalance portfolios to align with some the “concerns” as discussed above.
1) Trim Winning Positions back to their original portfolio weightings. (ie. Take profits)
2) Sell Those Positions That Aren’t Working. If they don’t rally with the market during a bounce, they are going to decline more when the market sells off again.
3) Move Trailing Stop Losses Up to new levels.
4) Review Your Portfolio Allocation Relative To Your Risk Tolerance. If you are aggressively weighted in equities at this point of the market cycle, you may want to try and recall how you felt during 2008. Raise cash levels and increase fixed income accordingly to reduce relative market exposure.
Could I be wrong? Absolutely. But what if the indicators are warning us of something greater?
What’s worse:
- Missing out temporarily on the initial stages of a longer-term advance, or;
- Spending time getting back to even, which is not the same as making money.
For the majority of investors, the recent rally has simply been a recovery of what was lost last year. In other words, while investors have made no return over the last year, they have lost 1-year of their retirement saving time horizon.
The decline was small this time.
But what about next time?
Currently, the risk of disappointment greatly outweighs the potential for upside surprises at this juncture and the market may already be telling us such is the case.
Yes, if the market reverses back into a more bullish trend, we will miss some of the initial upside but portfolios can be quickly realigned to participate with a much higher reward to risk ratio than what currently exists.
If I am right, however, the preservation of capital during an ensuing market decline will provide a permanent portfolio advantage going forward. The true power of compounding is not found in “the winning,” but in the “not losing.”As I noted in yesterday’s trading rules:
“Opportunities are made up far easier than lost capital.” – Todd Harrison