“Technically Speaking” is a regular Tuesday commentary updating current market trends and highlighting shorter-term investment strategies, risks, and potential opportunities. Please send any comments or questions directly to me via Email, Facebook or Twitter.
The big question for investors at the moment is whether the 9-year old bull market has finally come to its inevitable conclusion or is it just a “pause that refreshes?”
While the optimistic “hope” is that this is just a pause within a continuing “bull market” advance, from a money management standpoint getting the answer “right” is vastly more important to long-term investing outcomes.
The easiest way to approach this analysis is to start with the following basic premise:
“Bull markets are born on pessimism, grow on skepticism, and die on euphoria.” -Sir John Templeton
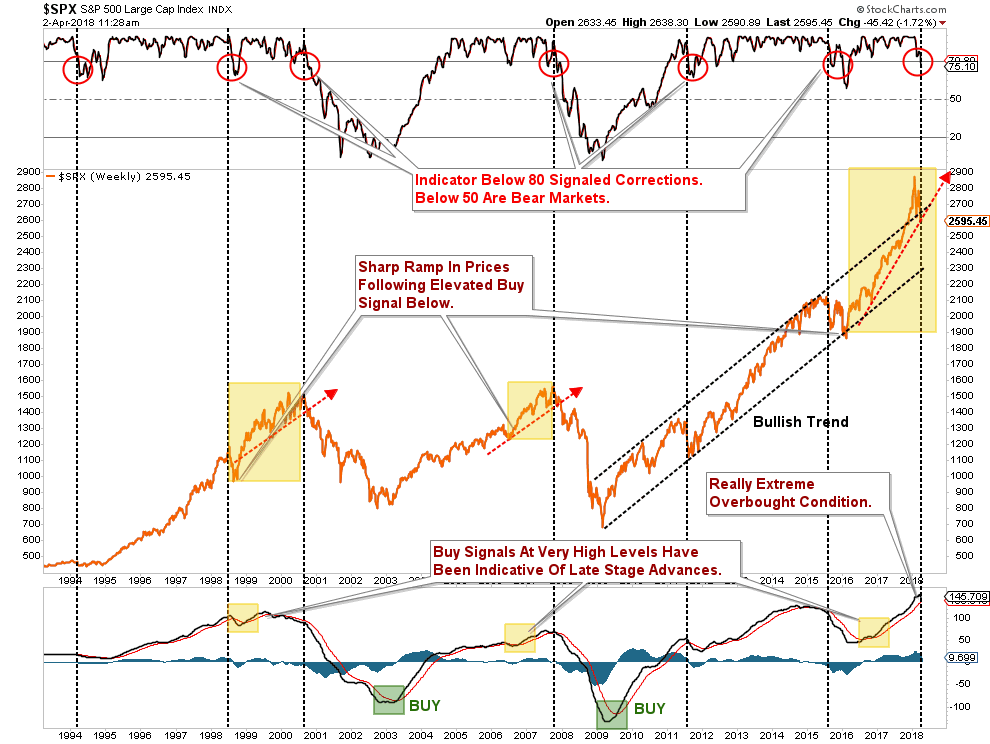
Take a look at the chart below which is Robert Shiller’s monthly data back to 1871. The “yellow” triangles show periods of extreme undervaluation while the “red” triangles denote periods of excess valuation.
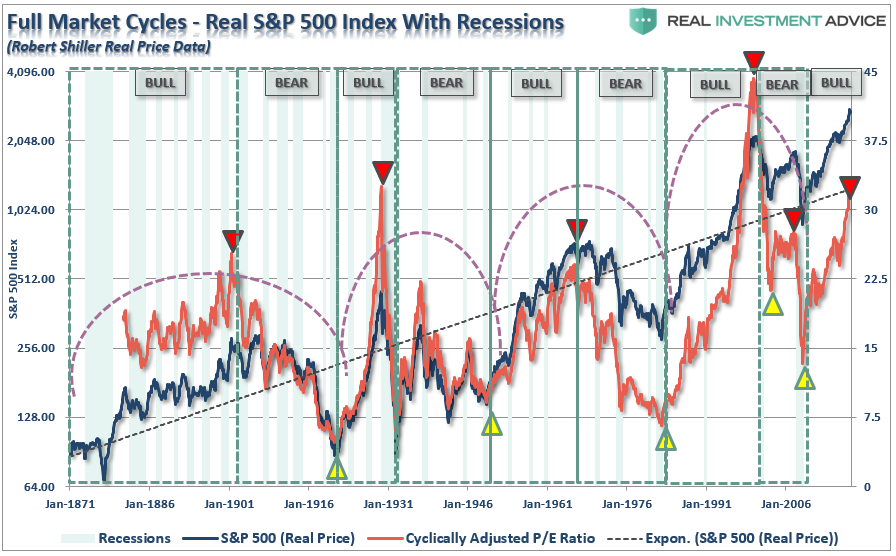
Not surprisingly, 1901, 1929, 1965, 1999, and 2007 were periods of extreme “euphoria” where “this time is different”was a commonly uttered phrase.
What about today? Is this another period of “euphoria” or are investors still maintaining enough “skepticism” to fuel the bull market further? Unfortunately, there is little evidence investors are “skeptical” of much of anything right now.
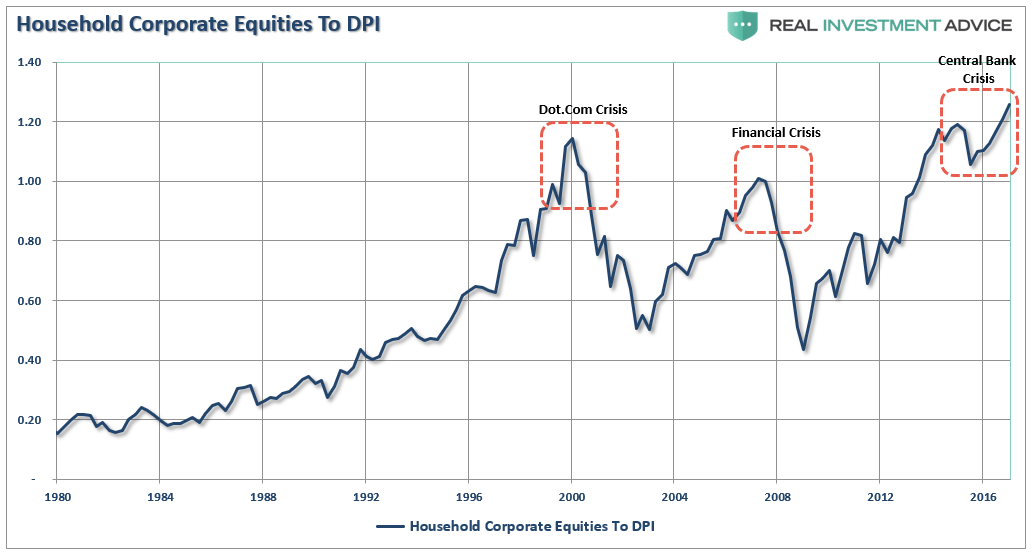
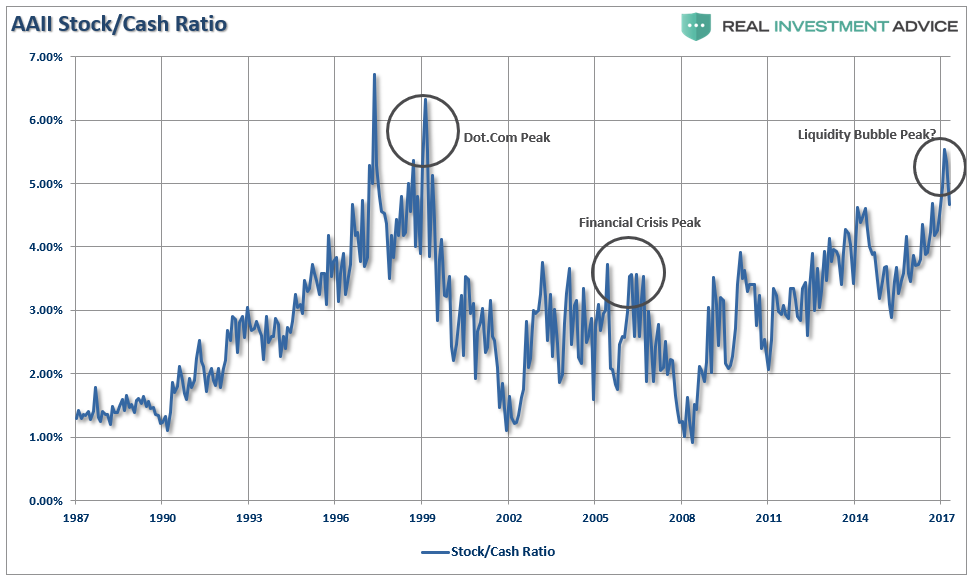
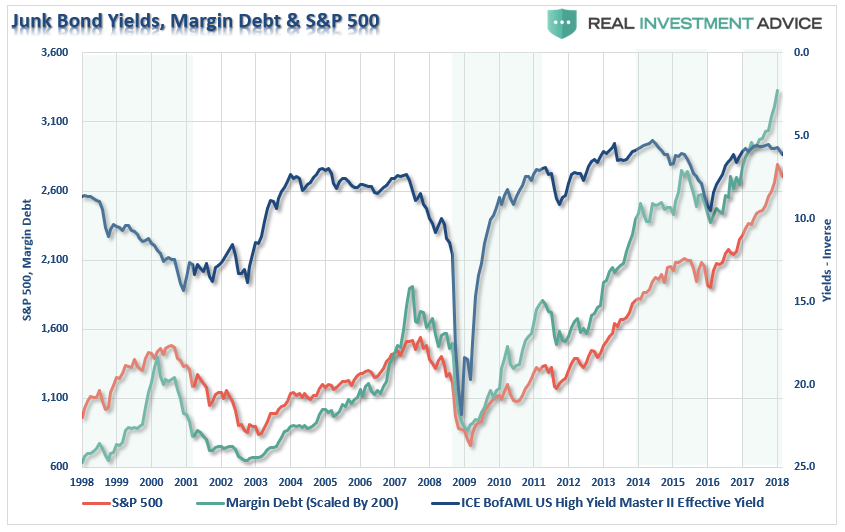
“However, for now, there is little doubt the bullish bias exists as individuals continue to hold historically high levels of equity and leverage, chasing yield in the riskiest of areas, and maintaining relatively low levels of cash as shown in the charts below.”
But the “euphoria” of individuals is not just solely related to the stock market, but to the whole economy as well. (The chart below is a composite index of the University of Michigan and Census Bureau measures.)
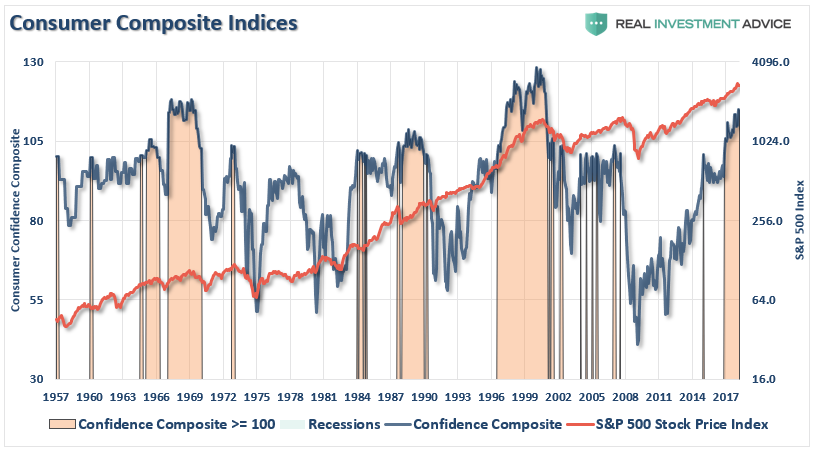
So, why shouldn’t there be “euphoria?”
The stock market has been surging for the last 9-years, unemployment claims are at the lowest levels in more than 30-years and the housing market seems to be firing on all cylinders.
What’s not to love? But that’s the point.
Bull Markets Die Of Euphoria
The reason that bull markets die of euphoria is that market prices, particularly in the “momentum” stage of the investing cycle, are based on the assumption the current cycle will continue into perpetuity. Earnings, the economy, sales, etc. will continue to expand in a linear fashion…forever.
Since the economy, as well as virtually everything in life, is cyclical, it is only logical that eventually the disappointment of those assumptions sparks the beginning of the next bear market cycle.
Currently, the list of things that could disappoint the markets continues to grow:
- The ongoing rhetoric from Washington over “trade wars” combined with complete fiscal irresponsibility,
- The reduction in support from Central Banks in terms of liquidity support.
- The continued insistence of the Fed to hike rates which continues to reduce the “low rate supports higher valuations” argument.
- The risk of further contagion from Facebook and other “big data” companies on the technology sector (which comprises roughly 25% of the S&P 500) as global threats of “internet taxes” or other data collection policies are considered.
- Revenue growth continues to remain weak which is leading to downward revisions in earnings estimates.
- Both domestic and international economic growth have peaked.
- Inflationary pressures from wage growth remain non-existent while the cost of living continues to rise (this will be exacerbated by Trump’s “trade wars.”)
- The yield curve continues to deteriorate and LIBOR has blown out which have typically been early warning signs of bad outcomes.
From a fundamental perspective, the bulls are losing much of the argument there as well. As my friend David Rosenberg recently penned (via Mauldin Economics):
“Dave Rosenberg used four different S&P 500 valuation metrics:
- Forward Price to Earnings Ratio
- Price to Sales Ratio
- Price to Book Value Ratio
- Enterprise Value to EBITDA Ratio
He then calculated the percentage of time that each of these had been at its present level or below. Here’s the result for P/E ratio.

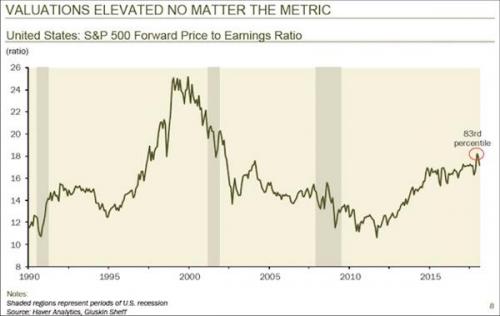
The S&P 500 forward P/E ratio has been below its present level 83% of the time since 1990. Repeating that exercise for the other three metrics and then averaging them, Dave found the index is presently at a 92nd percentile valuation event.
Here’s Dave, from the transcript, with my bold added:
In other words, only 8% of the time in the past has the stock market in the United States been as richly priced as it is today. And if you want to come up with reasons why that’s the case, that’s fine. But just understand that we are extremely pricey. We’re more than just a one standard deviation event versus the historical average.
Dave then showed this surprising table, comparing historic bull markets with GDP change during the same period.

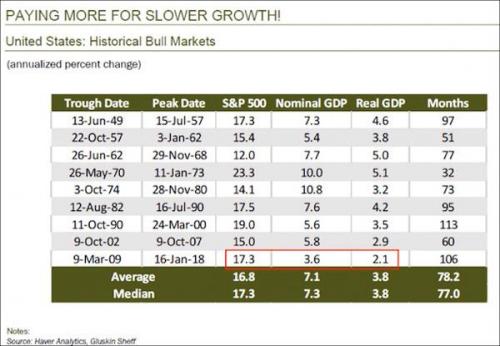
The 2009–2018 bull market from trough to peak averaged 17.3% annually. Nominal GDP rose 3.6% annually during that time, and real GDP rose 2.1%. Go up the table to the 1982–1990 bull run. It reached a similar magnitude at 17.5%, but nominal GDP rose 7.6% and real GDP 4.2%.
Yes, GDP has its flaws. Today’s economy isn’t like the 1980s. Nonetheless, how is it that stocks rose the same amount on half as much economic growth? Dave said that if the stock-GDP ratio today had remained what it was back then, the S&P 500 would be around 1,550 today.
That’s how excessive valuations are now.”
Okay. you get the idea. There is little evidence to support the “bullish case” other than “sentiment based” data which can, and does, change very rapidly.
When that change in sentiment is combined with extremely elevated, extended and bullish prices, the subsequent “mean reverting” event has been exceptionally nasty. Even with the recent “pause,” the market remains extremely extended and overbought.
Just how big of a correction from these levels would it be? As I detailed this past weekend:
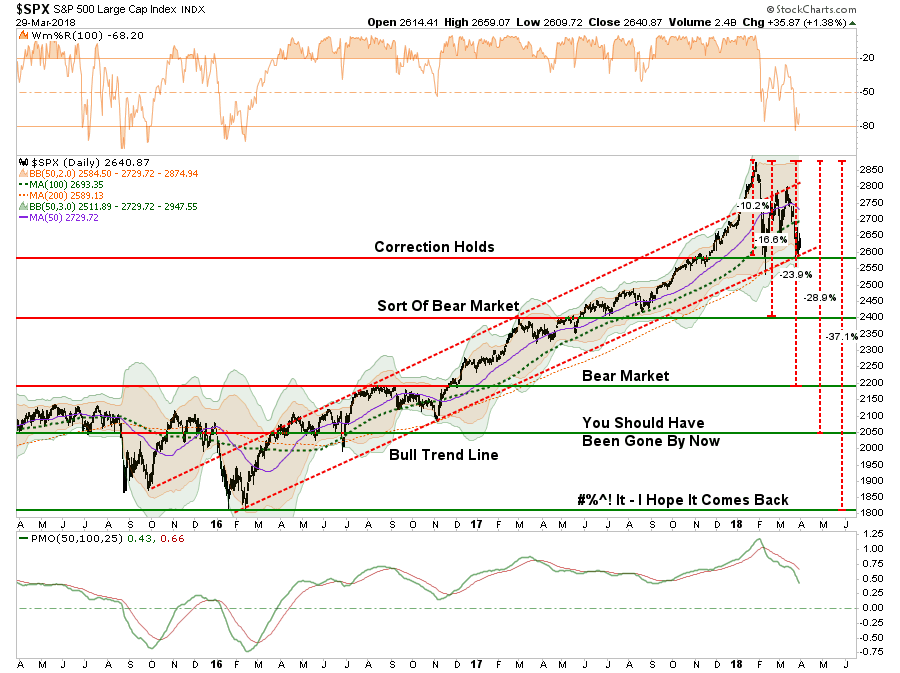
“The key levels from a price perspective are as follows:
- 2600 – Market holds at current correction levels and resumes bullish trend (optimistic)
- 2400 – Good support lies at 2400 but a 16% correction is painful. Long-term bullish trends remain intact.
- 2200 – Strong support from previous correction breakout. Official “bear market” with near 24% decline.
- 2050 – Economy likely in a recession at this point. Bear market grows with a 29% decline
- 1800 – There is likely a lot going wrong at this juncture and a 37% decline has destroyed most portfolios.
The important lesson here is not to debate on why the bull market will likely resume. Such could very well be the outcome particularly if global Central Banks leap back into action. The lesson is to understand the varying degrees of portfolio risk and have a plan to react if things go wrong.
As I noted last week, missing out on a rally in the market is extremely easy to make up. Recouping lost capital is an entirely different matter.”
Managing Past The Noise
There are obviously many more arguments for both camps depending on your personal bias. But there is the rub. YOUR personal bias may be leading you astray as “cognitive biases” impair investor returns over time.
“Confirmation bias, also called my side bias, is the tendency to search for, interpret, and remember information in a way that confirms one’s preconceptions or working hypotheses. It is a systematic error of inductive reasoning.”
Therefore, it is important to consider both sides of the current debate in order to make logical, rather than emotional, decisions about current portfolio allocations and risk management.
Currently, the “bulls” are still in control of the market. The long-term running bull trend remains intact…for now. The chart below is a MONTHLY chart of the S&P 500 from 2008 to present. What you see is that the bullish trend that began in 2009 remains at the moment and a correction back to that trendline would encompass a nearly 20% decline from recent highs.
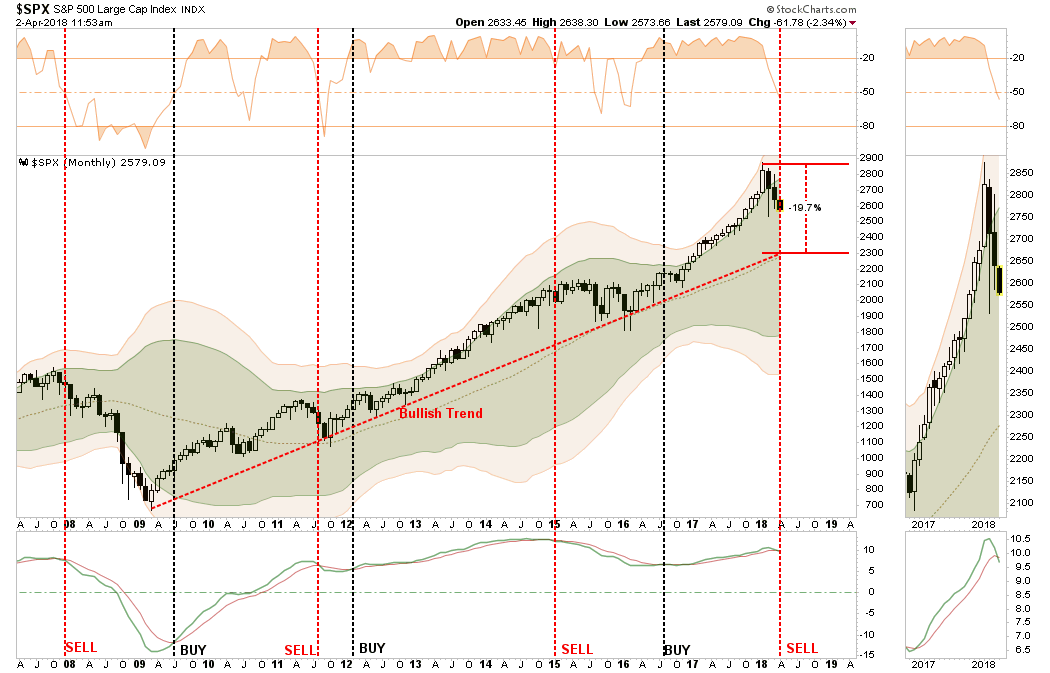
However, the real questions is whether this is simply a correction within the longer-trending bull market, or is the initiation of the monthly “sell signal” coincident with the previous late-2007 signal that developed into a major “mean reverting” event? (As a side note, the monthly “sell signal” was also triggered in mid-1999 and no one paid attention then either.)
I am not willing to “ride this out” waiting to see what happens. As noted in the chart below, the market is oversold enough on a short-term basis for a reflexive rally to either the top of the current downtrend channel (2625ish) or the 100-dma (2675ish). In both cases, we will be further reducing equity exposure, rebalancing risks and adding hedges to portfolios.

If the market “heals up” and begins a stronger, fundamentally based recovery, we will redeploy capital accordingly. If not, and the market enters a bigger corrective process, the excess levels of cash will hedge portfolios against further destruction of capital.
Here are some basic guidelines we follow in our process.
- Sell positions that simply are not working. If they are not working in a strongly rising market, they will hurt you more when the market falls. Investment Rule: Cut losers short.
- Trim winning positions back to original portfolio weightings. This allows you to harvest profits but remain invested in positions that are working. Investment Rule: Let winners run.
- Retain cash raised from sales for opportunities to purchase investments later at a better price. Investment Rule: Sell High, Buy Low
These rules are hard to follow because:
- The bulk of financial advice only tells you to “buy”
- The vast majority of analysts ratings are “buy”
- And Wall Street needs you to “buy” so they have someone to sell their products to.
With everyone telling you to “buy” it is easy to understand why individuals have a such a difficult and poor track record of managing their money.
While “bearish” concerns are often dismissed when markets are rising, it does not mean they aren’t valid. Unfortunately, by the time the “herd” is alerted to a shift in overall sentiment, the stampede for the exits will already be well underway. Just remember, the process of “getting back to even” is not an investment strategy that will work over the long term.
Is the current bull market dead? I don’t know, and trying to predict the market is quite pointless. The risk for investors is the “willful blindness of change” until it is far too late to matter. Just remember, no one thought the “bull market was dead” in 1999 and 2007 either.
I don’t need to remind you what happened next.
Lance Roberts
