Wolf Richter wolfstreet.com, www.amazon.com/author/wolfrichter
But China and the tax havens like Luxembourg, oh my!
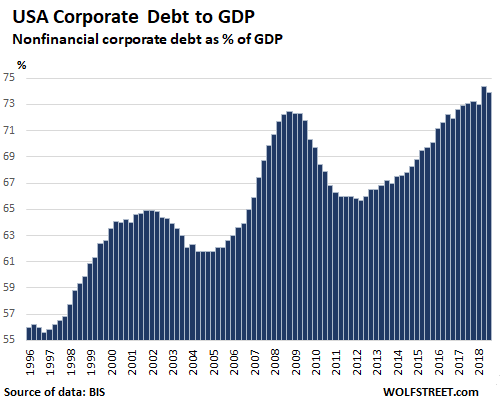
US corporate debt, excluding debt by banks – so “nonfinancial” corporate debt – has surged in recent years by all measures and to such an extent that it was featured prominently in the Fed’s Financial Stability Report, in terms of what might trigger the next financial crisis. The Fed is counting total nonfinancial business debts, which include the debts of businesses that are not incorporated. It found about $17 trillion in debts.
A narrower measure is nonfinancial corporate debt, which amounts to $15 trillion. This is up a breath-taking 40% from the prior peak in 2008. The Bank for International Settlements (BIS) uses this measure to compare how corporate debt stacks up in different countries. One of its measures is corporate debt denominated in local currency; and in order to determine the relative size of this debt, the BIS expresses it as a percent of nominal local-currency GDP. So Chinese debt in yuan as a percent of Chinese GDP in yuan. By this measure, the US nonfinancial corporate debt-to-GDP ratio has ballooned to the highest ever: a stunning whopping 73.9% of GDP:
But the US is only in 25th Place
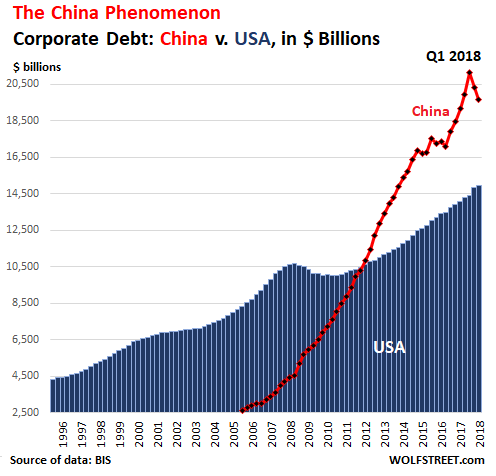
The BIS also converts local-currency debt to dollars, so that the total debts can be compared from one country to another. And the US corporate debt of $15 trillion pales compared to China’s corporate debt of $19.7 trillion.
But that is down from the $21.1 trillion in Q1 2018, at which point Chinese authorities got serious about deleveraging the corporate sector. The monstrous pileup of corporate debt in China happened in just 12 years:
China’s economy, while growing much faster than the US economy, is still quite a bit smaller than the US economy, when measured by GDP in US dollars. And so among the larger economies, China’s corporate-debt-to-GDP ratio is unrivaled (though there are some small economies with special tax laws that blow right past China for other reasons, and we’ll get to those in a moment). The data for China goes back only to 2006. Note the effects of China’s efforts to deleverage its corporate sector, with corporate debt-to-GDP ratio now down to 152.9%:
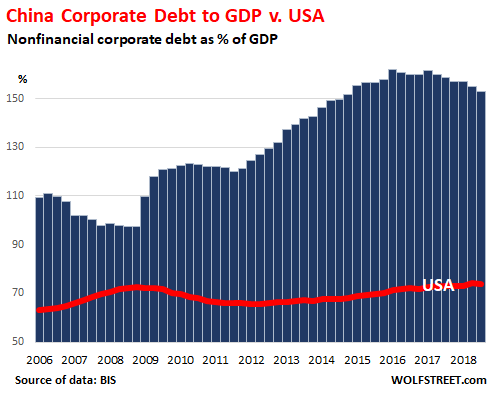
But China is only in 7th Place by debt-to-GDP
The tax-haven syndrome mucks up the numbers. Ahead of China in terms of the corporate debt-to-GDP ratio are a gaggle of small countries that are in effect tax havens for global corporations, including US companies whose debts start showing up in Ireland and elsewhere because that’s where they’re suddenly headquartered. Number one is tiny Luxembourg. There are five of those countries ahead of China, plus Sweden, which leaves China in 7th place.
So here we go with out debt countdown:
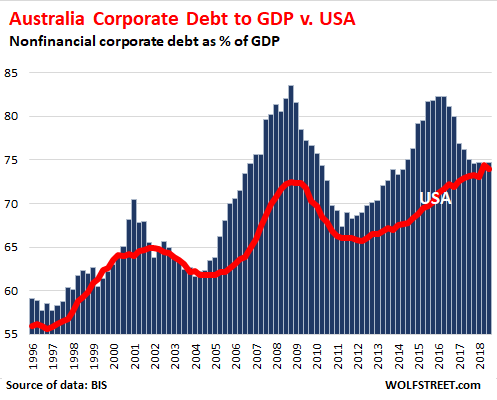
#24: Australia corporate debt-to-GDP ratio: 74.7%
Australia is a notch ahead of the US, with a corporate debt-to-GDP ratio of 74.7%. Because the differences between countries are so huge, it is impossible to put the charts on the same scale. To keep a sense of perspective, I added a red line for the US in each chart, and as we go down the line-up, and as the corporate debt-to-GDP ratio balloons country by country, we will see that red line getting pushed lower and lower until it is just an insignificant little thing at the base of the chart.
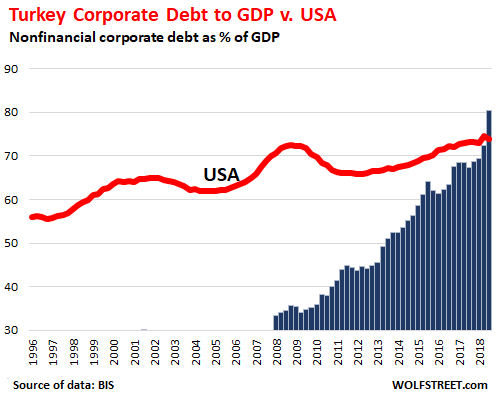
#23 Turkey corporate debt-to-GDP ratio: 80.3%
Turkey is already in the middle of a crisis that is composed of a currency crisis, an inflation crisis (20%), and a debt crisis. Much of the debt in Turkey is denominated in foreign currency, mostly euros and dollars, and so inflation in Turkey just makes the debt-service burden worse. After a blistering surge of corporate debt over the past few years, the corporate debt-to-GDP ration of Turkey finally beat that of the US in 2018, at 80.3%:
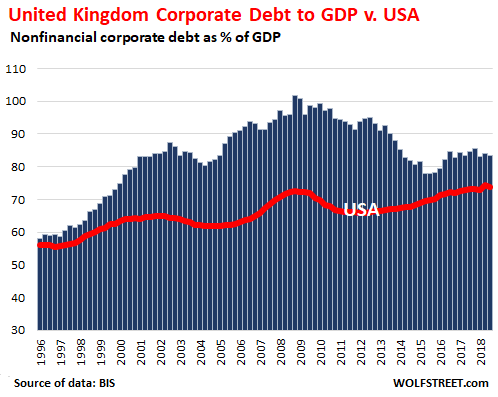
#22 United Kingdom corporate debt-to-GDP ratio: 83.3%
The UK debt-to-GDP ratio has been high for years, and is in part related to the City of London as a tax haven for global corporations. But 83.3%, it’s down from 101% at the beginning of the Global Financial Crisis:
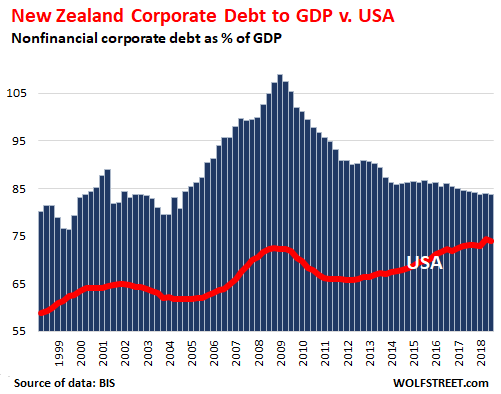
#21 New Zealand corporate debt-to-GDP ratio: 83.8%
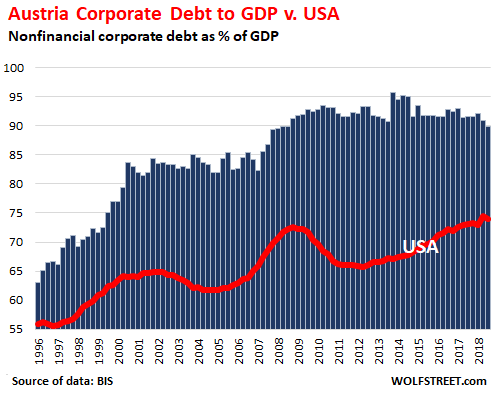
#20 Austria corporate debt-to-GDP ratio: 89.9%
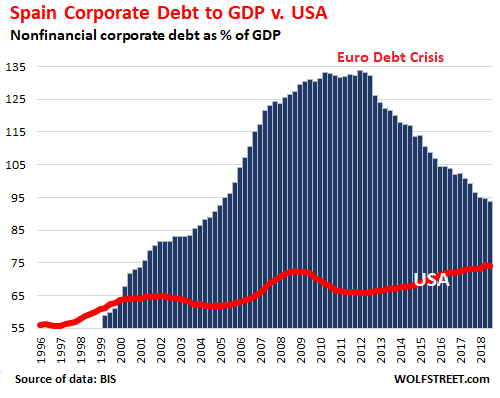
#19: Spain corporate debt-to-GDP ratio: 93.7%
Note the deleveraging that has taken place since Spain’s brutal financial crisis during the euro debt crisis. This is an exemplary chart of what leads to a financial crisis and how it gets resolved:
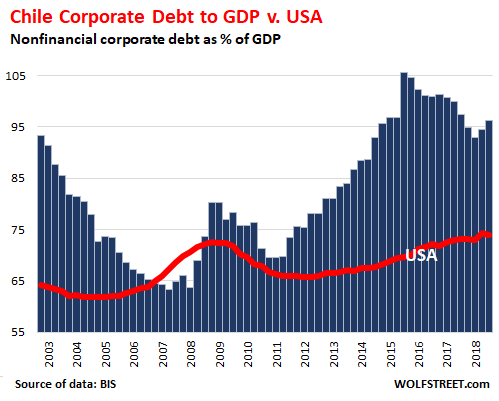
#18 Chile corporate debt-to-GDP ratio: 96.3%
The data goes back to only 2003.
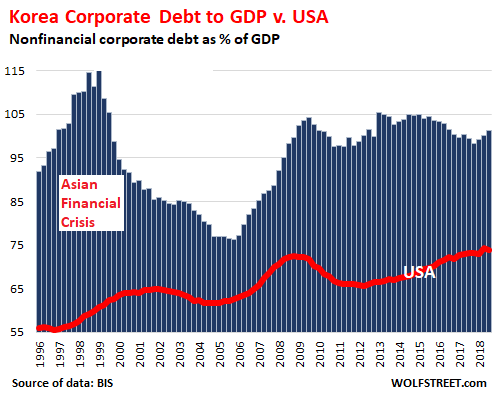
#17 South Korea corporate debt-to-GDP ratio: 101.2%
And the effects of the Asian Financial Crisis that kicked off in 1997 are perfectly visible:
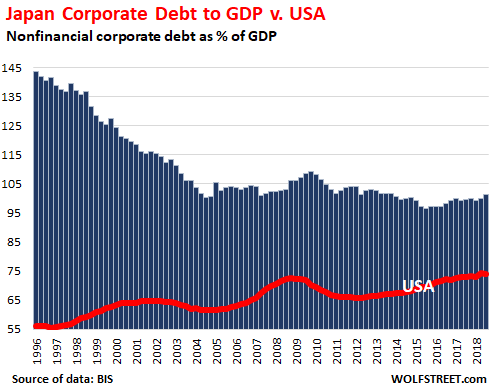
#16 Japan corporate debt-to-GDP ratio: 101.2%
Japan’s corporate sector deleveraged for over 15 years from its world-class debt bubble that imploded in 1989:
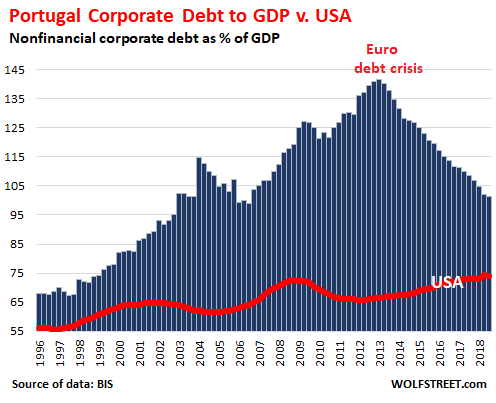
#15 Portugal corporate debt-to-GDP ratio: 101.4%
A financial crisis, such as Portugal’s or Spain’s, always ends the same: pain and forced deleveraging (defaults or otherwise). And there is still some deleveraging left to do.
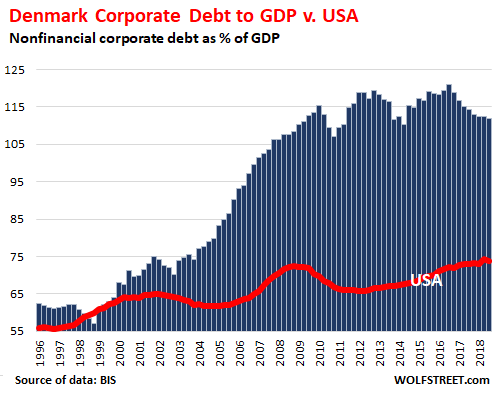
#14 Denmark corporate debt-to-GDP ratio: 111.8%
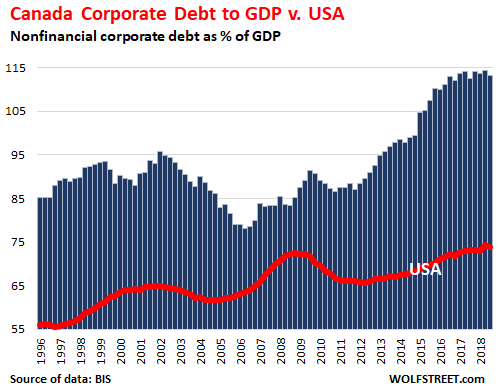
#13 Canada corporate debt-to-GDP ratio: 113.2%
Canada is of course noted for its household debt that ranks among the highest in the world. But it’s also doing a good job in the corporate sector.
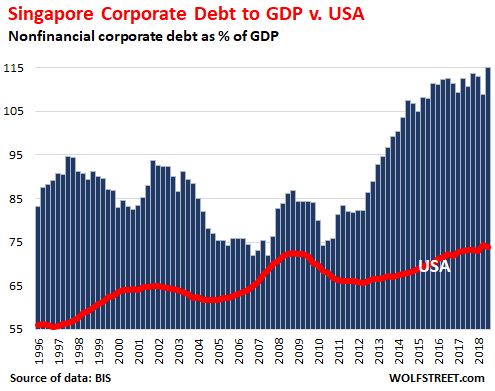
#12 Singapore corporate debt-to-GDP ratio 114.9%:
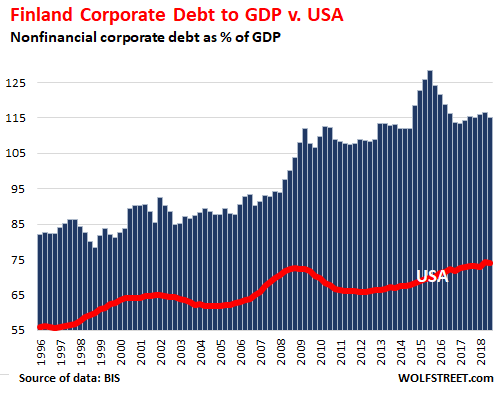
#11 Finland corporate debt-to-GDP ratio 115.1%:
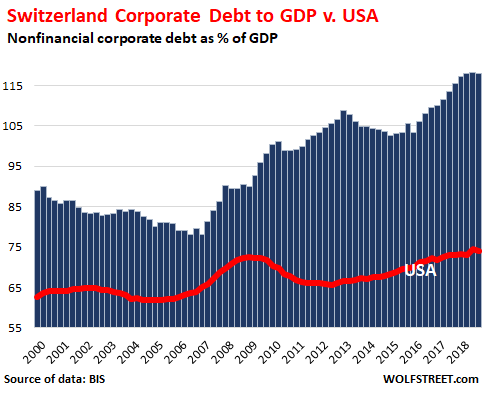
#10 Switzerland corporate debt-to-GDP ratio 118%:
The data for Switzerland only goes back to 2000.
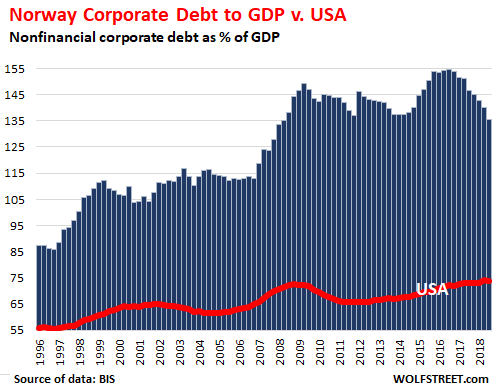
#9 Norway corporate debt-to-GDP ratio 135.4:
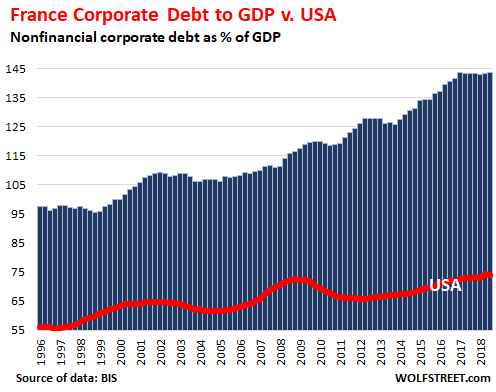
#8 France corporate debt-to-GDP ratio 143.6%:
As is the case in some other countries, the French corporate sector is dominated by enterprises that are either wholly or partially owned by the state and that used to be entirely owned by the state before being partially privatized. They have enormous amounts of debt, which is assumed to be backed by the French state.
#7 China corporate debt-to-GDP ratio 152.9%:
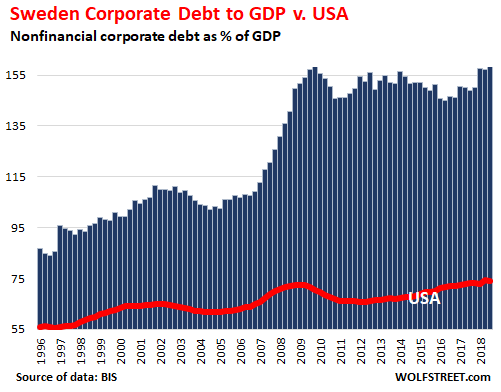
#6 Sweden corporate debt-to-GDP ratio 158.2%:
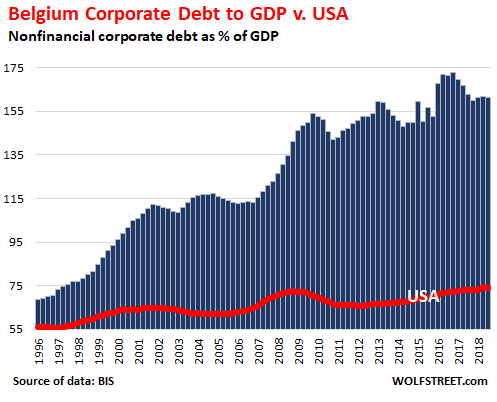
#5 Belgium corporate debt-to-GDP ratio: 161.1%
Belgium is the location of Euroclear that holds about $32 trillion in assets in fiduciary accounts and it has come other advantages for global corporations.
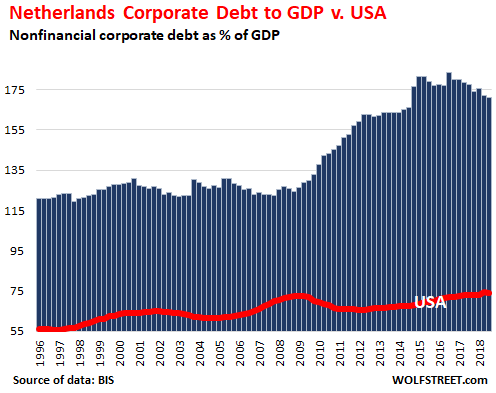
#4 Netherlands corporate debt-to-GDP ratio: 170.8%
Now we’re getting into the smorgasbord of corporate tax avoidance techniques — delicious sounding menus items like “double Irish with a Dutch sandwich” — for large corporations that might impact where and how their debts are registered.
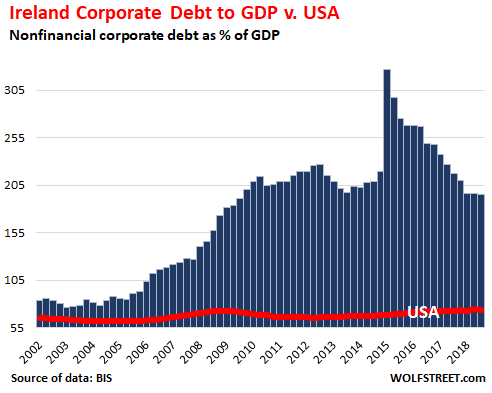
#3 Ireland corporate debt-to-GDP ratio: 195.3%
The hottest thing for US corporations was to engineer a move to Ireland on paper, to dodge US taxes. One of these maneuvers is a corporate tax inversion. For example, Allergan, a pharmaceutical giant that generates most of its sales in the US, was formed in 2015 when Irish–registered Actavis acquired the much larger US company and assumed Allergan’s name. Actavis, formerly a US company as well, had performed the same feat in 2013. These companies didn’t actually move to Ireland, but now at least some of their corporate debt is shows up in Irish data — instead of in the US data:
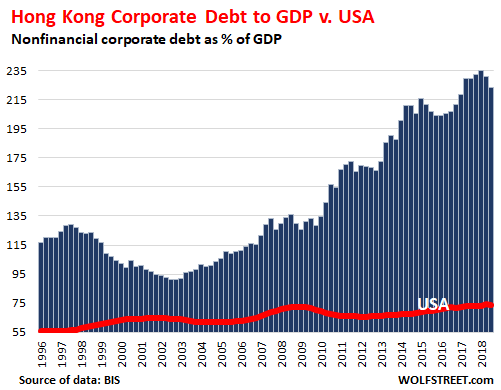
#2 Hong Kong corporate debt-to-GDP ratio: 222.9%
This is where China’s corporate debt like to hang out. And much of it should be added to China’s tally.
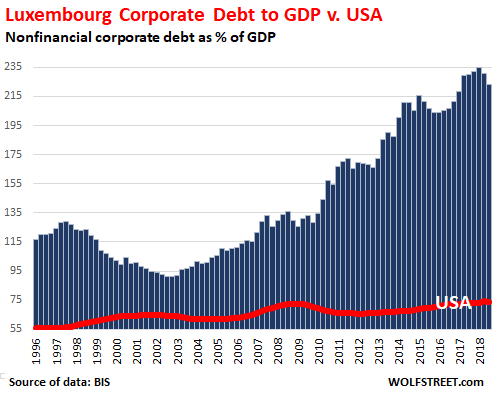
#1 Luxembourg corporate debt-to-GDP ratio: 222.9%
“Many companies, regardless of their industry or origin, have already made the choice to locate their headquarters in Luxembourg like ArcelorMittal, the world’s largest steelmaker, RTL Group, the European leading radio and TV broadcaster, satellite services leaders SES and Intelsat, intercontinental airfreight company Cargolux, or internet giants Amazon, Skype and Paypal,” brags the Luxembourg office of KPMG that helps manage these mailbox headquarter. Which explains this:
Dear reader, this concludes another chapter in the amazing global debt saga.