- Those are not only the capital markets that are shaking this month.
- October 2018 is the first month since 2008 that the Fed is inactive in the market.
- We are due to see another squeeze out of money from the markets in the coming days.
- The Fed forecast for November indicates huge redemptions of government bonds.
Black October? So it seems, just as history suggests.
Since the beginning of the month, global stocks (VTI, VEA, EFA) areexperiencing sharp declines, liquidity keeps evaporating (intensifying the roller-coaster we’re anyhow witnessing), the US Dollar is climbing (now close to a record high), and even the credit market (normally a “run to safety” benefactor) is offering anything but stability.
As we claim since the start of this year, it’s all quite simple and one needs to look no further than at the Fed balance sheet.
Due to the high correlation between the Fed balance sheet and the markets (performance), any change in the balance sheet is almost immediately causing the markets to move in the same direction the total holdings are moving into.
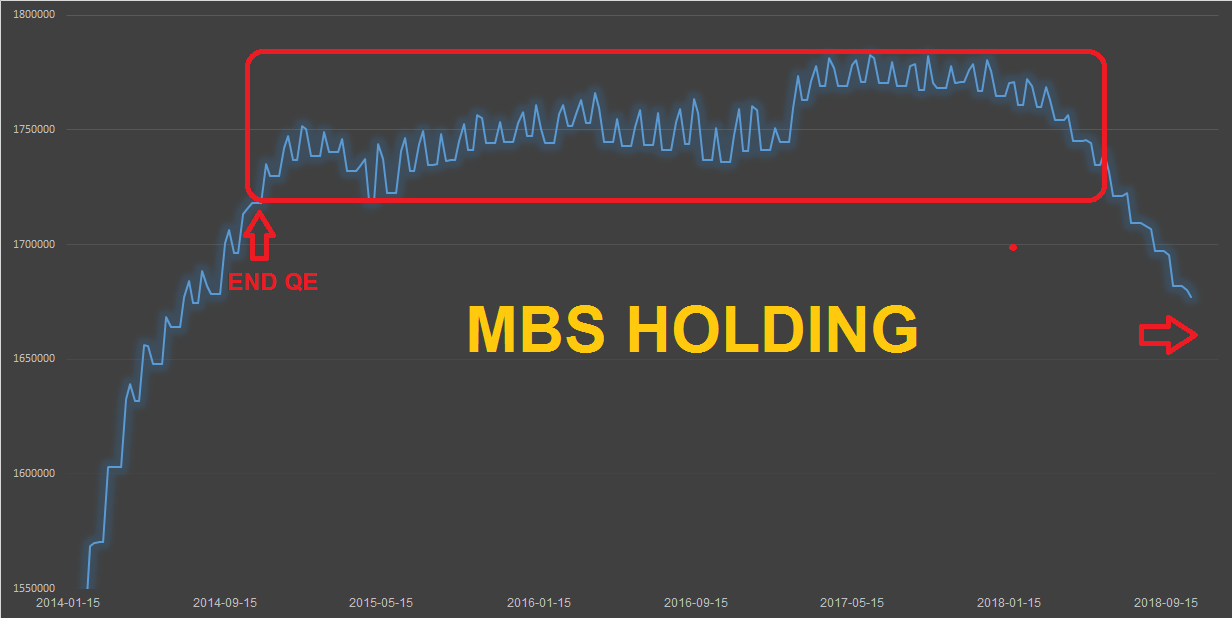
According to the Fed’s most recent balance sheet weekly report (released every Wednesday), the bank’s total holdings fell by $3.2B, most of which came out of mortgage-backed securities (“MBS”).
A quick calculation, using the last two reports, reveals that the Fed sucked out nearly $15B-worth of MBS over the last couple of days alone, in order to get closer to the $20B target it originally set for this month.
In the below chart you can see the Fed’s total MBS holdings and the outlook/target for the next weekly report.
Another very important factor investors need to pay attention to is the new monetary era we’ve entered into.
October marks the first time since the 2008 financial crisis, where the Fed isn’t involved in any (significant) repurchasing (of bonds) activity. This means that following a decade-long of non-stop intervention, the fed is now stepping aside, letting the markets get their act together, freely – without the “big brother” pulling the strings behind the scenes.
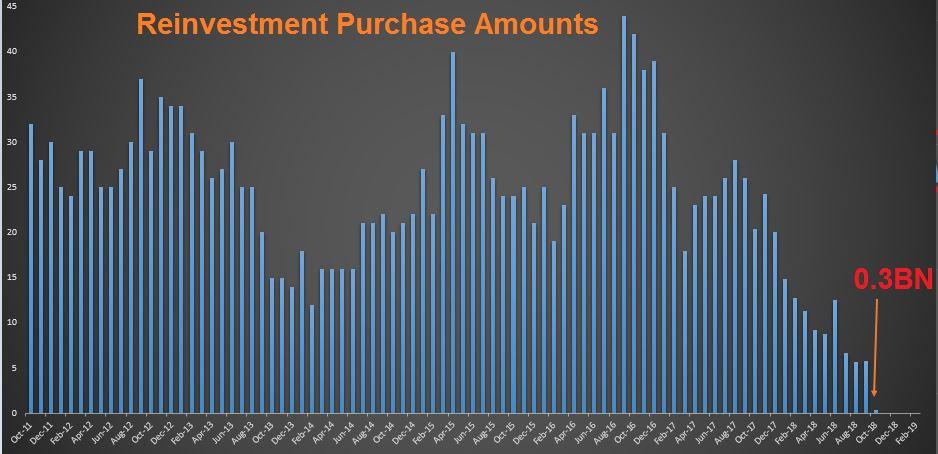
Since 2011, as you can see in the chart below, the Fed was involved in massive purchases that, in turn, completely changed the market’s dynamics. No more!
From now on, the market can move freely and, hopefully, more efficiently, without fearing of/hoping for (depends how you look at it) further interventions.
The amount of repurchases the Fed is conducting this month is a mere $300M, a tiny-negligible amount compared to the norm/average. To put things into the right perspective, bear in mind that in October 2017, the Fed executed $20.7B-worth of buybacks, and in October 2016, it repurchased no less than $42B. We are talking now about a fraction of these past-gigantic amounts.
Some people already lost their faith in seeing a truly free market again, during their lifetime. Many have completely disbelieved that the day (when the Fed steps aside) will ever come.
Well, there you go. The Fed (not only Elvis) has left the building. Completely (almost). That, of course, until the next crisis, when the building will need to be reoccupied with all sorts of creative QE-inhabitants…
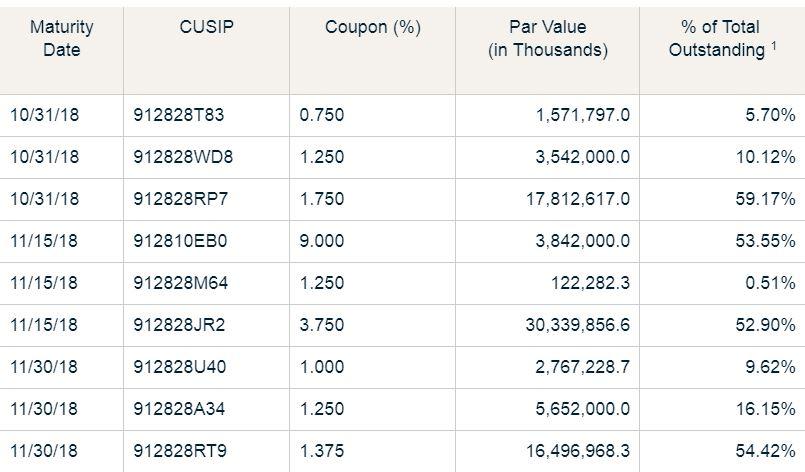
US Treasuries mature either at the middle, or at the the end of a month. As such, the next big change in the Fed’s balance sheet is expected to take place this coming Wednesday (10/31/2018), with a redemption of about $22B of US government bonds (SHV, SHY, IEF, TLT), and no repurchase whatsoever.
Again, just to make sure we are clear about this: $22B-worth of bonds are getting sucked out of the market, while the Fed refrains from putting even a single Dollar (out of the proceeds) back to work. Hallelujah!
According to its unwinding master plan, the Fed is now supposed to reduce the balance sheet by $50B per month. Of course, the master plan must face (and adjust to) reality, i.e. bonds that reach maturity. Since the Fed isn’t actively selling bonds in the market (only let bonds to mature naturally, without reinvesting the proceeds) – the actual amount that is being drawn-out of the market depends on the… market itself, rather on the Fed’s master plan.
Therefore, although the Fed is aiming for a $50B drop in its balance sheet, the actual number for October is going to be lower – only about $42B – simply because there aren’t enough bonds maturing this month.
Unlike October, there are going to be huge redemptions in November – circa $60B in total, mostly at the middle of the month.
Even before that, we have October 31st that is going to see $23B of redemptions as well.
It will be interesting to see whether and how the markets react to this larger-than-usual amount of bonds reaching maturity.
Even more interesting is to see how long can/will the Fed keep-on going like this, without “blinking”, in case that the market turmoil continues.
The Fed is already under (only verbal, for now) pressure by President Donald Trump, and if the US main indices (SPY, DIA, QQQ, IWM) keep shaking a while longer – it will be hard for the Fed to stick to the current path (of rate hiking).
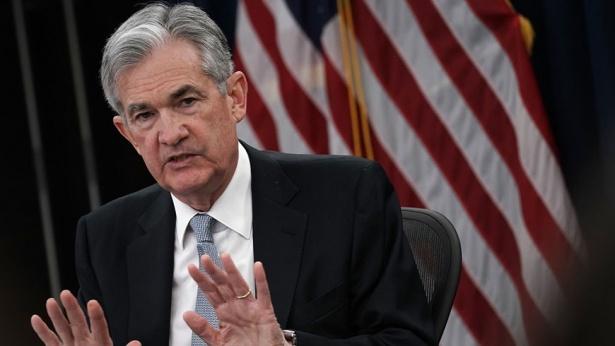
Every time we do something great, he raises the interest rates… Almost looks like he’s happy raising interest rates… I’m just saying this: I’m very unhappy with the Fed because Obama had zero interest rates. – President Trump lashing out at Federal Reserve chairman, Jerome Powell, in a Wall Street Journal interview.
Traders are wondering when the Fed put will come back into play. Some are betting that the worst monthly performance since 2009 for US stocks will be enough.
Those are not only the capital markets that are shaking these days, but also the political arena, ahead of the US mid-term elections.
As you recall, Donald Trump was touting the stock market surge for many months, frequently using his very active Twitter (TWTR) account for that purpose. Here’s an example from the beginning of this year:
Problem is, that the market on October 26th isn’t the same market we’ve seen back on January 5th. The market turning sour, at a very bad timing from Trump’s perspective, is now becoming a double-edge sword.
It’s safe to assume that many political figures are shaking these days, just as much as the capital markets are, if not more.
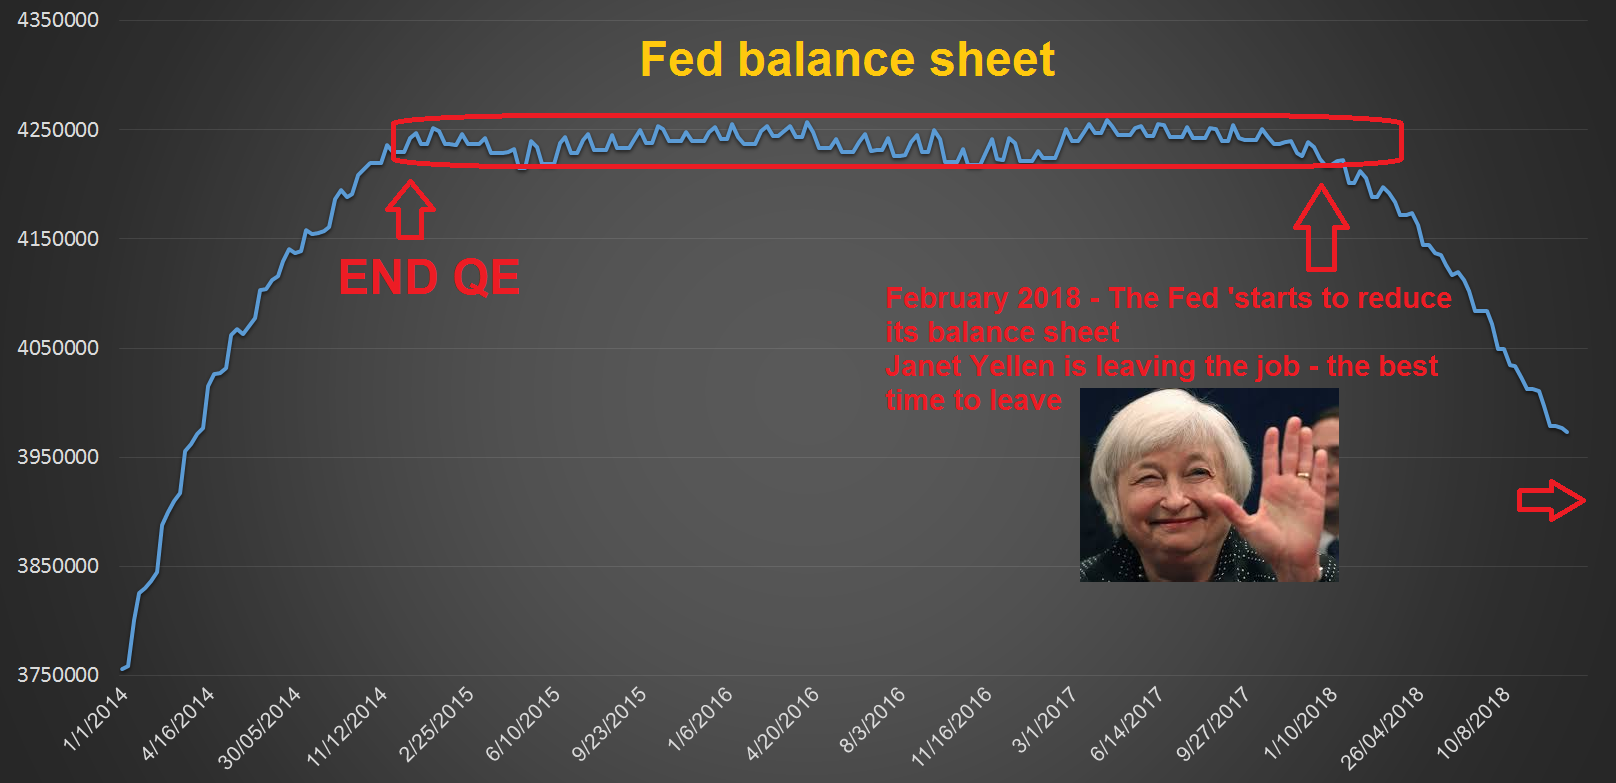
Looking at where the Fed’s total holdings are expected to be over the next few weeks (note the departure date of the previous Fed chair), one can’t help but wondering is President Trump might be missing Janet Yellen, after all…
Taking into consideration the recent actions/directions of the European Central Bank (“ECB”), it appears that the fading support that the two most influential central banks have provided for the capital markets throughout the years – is starting to have a real-negative impact.
The next two months (till year-end) – where the Fed refrain from intervening on one hand, and the ECB stop buying European government bonds (VGK, EZU, HEDJ, FEZ) on the other hand – may provide another reason for the markets to test new lows.
When such a shift in monetary policies is combined with very low liquidity (in the markets) – the chances for extreme moves/events rise significantly. Add to the mix the upcoming mid-term elections in the US, and you get yourself an extremely sensitive, explosive and very shaky situation.
The mounting pressure, on both economic and political fronts, also explains the president’s frequent attacks on the Fed and its chairman in recent weeks.
Since 2008, almost everything that is/was going in the markets has been originated, orchestrated and/or determined by central banks. Now, they want to move back to normality – leave the very loosen monetary policies they have implemented behind, and allow the markets to be free and efficient, once again; it’s about time, isn’t it?
Nevertheless, they seem to discover (much quicker than they probably imagined) that planning is one thing and executing is another.
As we all know, the road to (what seems to be) “hell 2018” is (hopefully) paved with good intentions, just as the the road to (what turned out to be) “heaven 2008” was (retrospectively) paved with bad intentions…
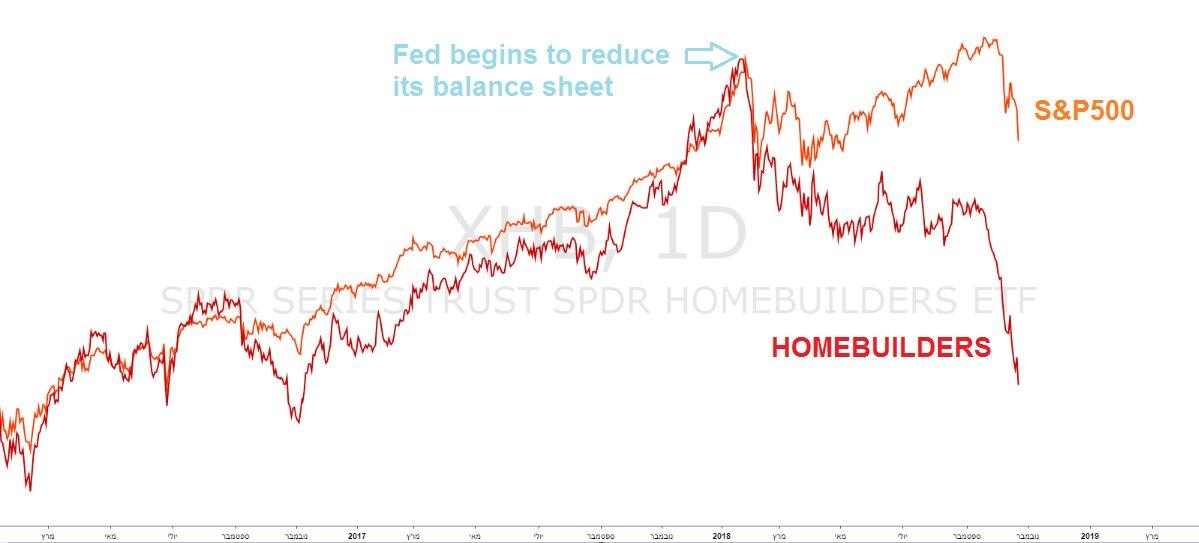
One last thing, worthwhile touching upon, is the continued weakness among the homebuilders and construction stocks (PKB, XHB, ITB, AIRR).
We have been monitoring the gap between these ETFs to the S&P 500 ever since the Fed began the process of reducing its balance sheet. As you can see below, that gap is already huge and keeps widening, (almost) every week, over the past few months.
If the S&P 500 “decides” to close down that gap, it would mean that the index “needs” to drop all the way to the ~2100 level.
Note also that residential investments – that are known to consistently and substantially contributing to weakness ahead of recessions (!) – fell 4% during the past quarter, marking the third straight quarterly decline. That hasn’t happened since late 2008 and early 2009. Go figure…
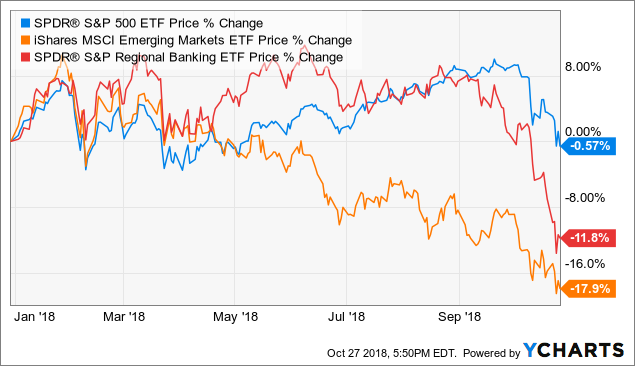
Similar, though smaller, gaps exist between i) the S&P 500 and emerging markets (EEM), as well as between ii) the S&P 500 and the regional banks sector ETF (KRE).
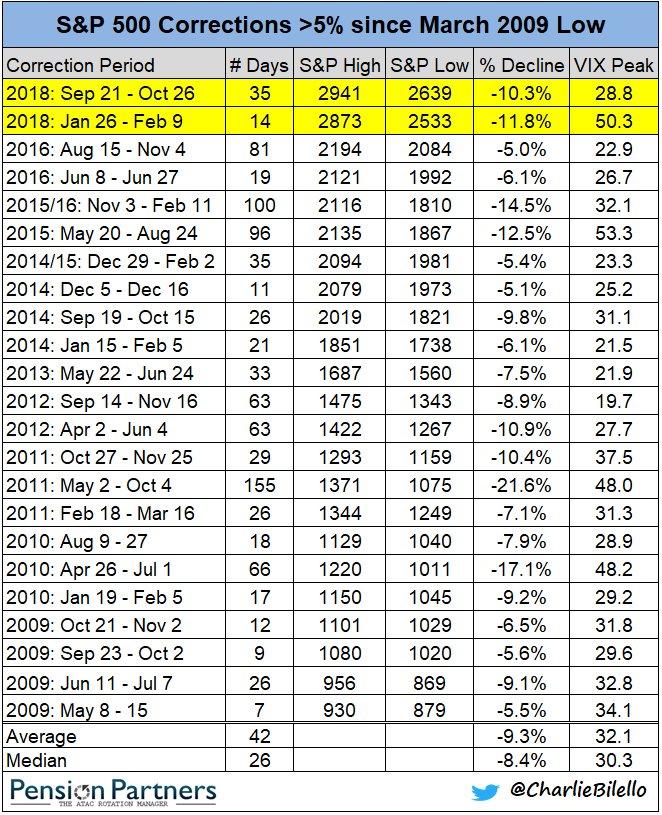
In 2017, the S&P 500 went the entire year without even a single 3% pullback. This year there have already been two 10%+ corrections.